Just imagine for a moment that you are monitoring a stock that has been moving up all morning. The candles look strong, and you’re already thinking about entering. But then you hesitate. Is the move actually strong, or is it starting to fade? Has it already run too far?
This is exactly where technical indicators for trading can help clear things up. The issue is that most beginners go the opposite way. They load up their chart with every indicator they can find, hoping one of them will magically give the “right” answer. What usually happens instead is that the chart becomes messy, signals start contradicting each other, and you end up more unsure than when you started.
Quick answer: Technical indicators don’t predict where a stock will go next. They help you read four things: trend, momentum, volatility, and volume, so you can interpret what price is already doing, not guess what it’ll do next.
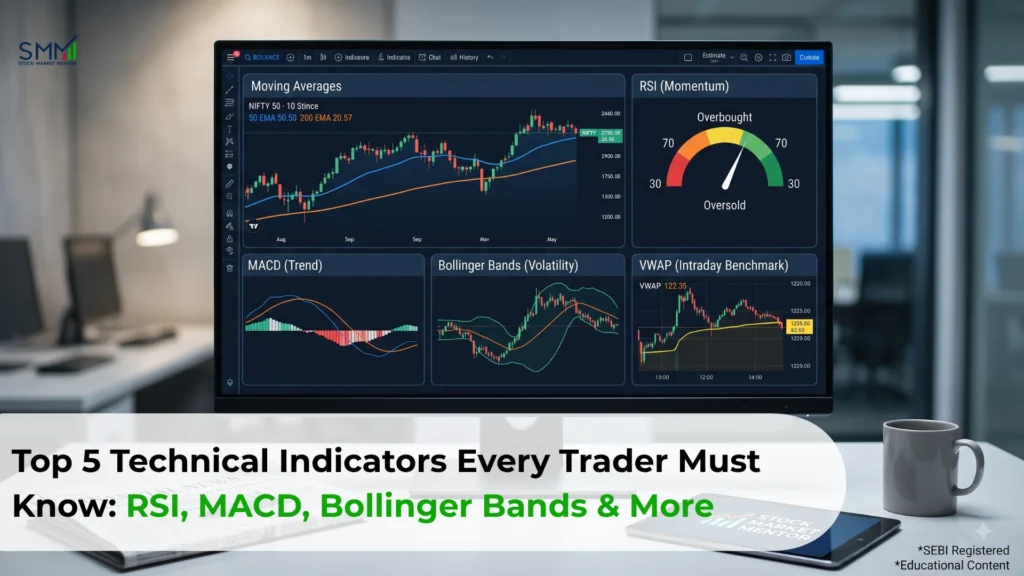
We picked these five because, together, they cover all four of those angles rather than repeating the same signal in different clothes: RSI (momentum), MACD (momentum shift), Bollinger Bands (volatility), VWAP (intraday price/volume), and moving averages (trend). Add a sixth indicator from the same category, and you’re usually just adding noise, not new information.
Once you stop treating them like signals to blindly follow and start using them for what they’re actually meant to show, things get a lot clearer. In the sections ahead, we’ll go through these five indicators one by one and see how they actually fit into real trading decisions.
What Are Technical Indicators and Why Do Traders Use Them?
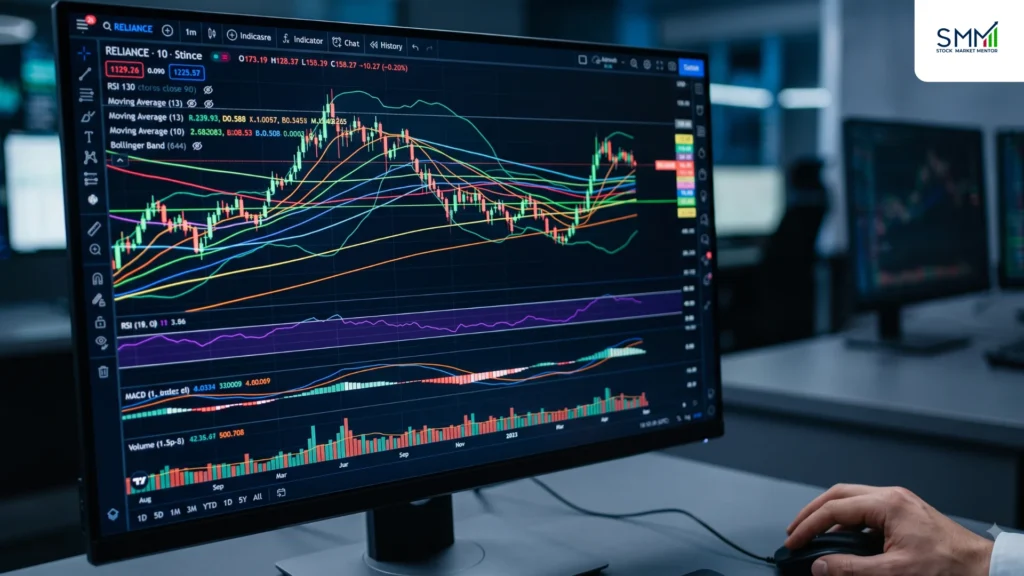
Price tells you what happened. It doesn’t clearly tell you how strong a move is, whether it’s slowing down, or whether the market has gotten stretched, which is why traders lean on indicators. SEBI’s own investor-education material describes technical analysis as the use of price charts and trading patterns to study short-term market behaviour, as distinct from fundamental analysis of a company’s underlying value.
For example:
- RSI tells you about momentum.
- Moving averages show trend direction.
- Bollinger Bands show volatility.
- VWAP shows where most trading activity happened during the day.
But here’s something beginners often miss: indicators don’t predict the market. They only help you interpret what’s already happening. The choice between technical vs. fundamental analysis depends on whether you’re studying price behaviour or a company’s underlying business and financials.
1. RSI – How to Read Overbought and Oversold Conditions
RSI (Relative Strength Index) is one of those indicators almost every trader tries first.
It moves between 0 and 100 and is usually set to 14 periods by default. RSI indicator in India basically answers one question: Is momentum speeding up or slowing down?
How Traders Usually Read RSI?
- Above 70 → the market may be “overheated”.
- Below 30 → market may be “oversold”.
- Around 50 → neutral zone.
Also note that just because RSI is above 70 doesn’t mean the stock will fall. Strong stocks can stay “overbought” for a long time while still going higher. Same thing on the downside: weak stocks can stay oversold and keep falling.
So RSI is not a buy/sell button.
A better way to use it is to ask: Is momentum supporting the price move or not?
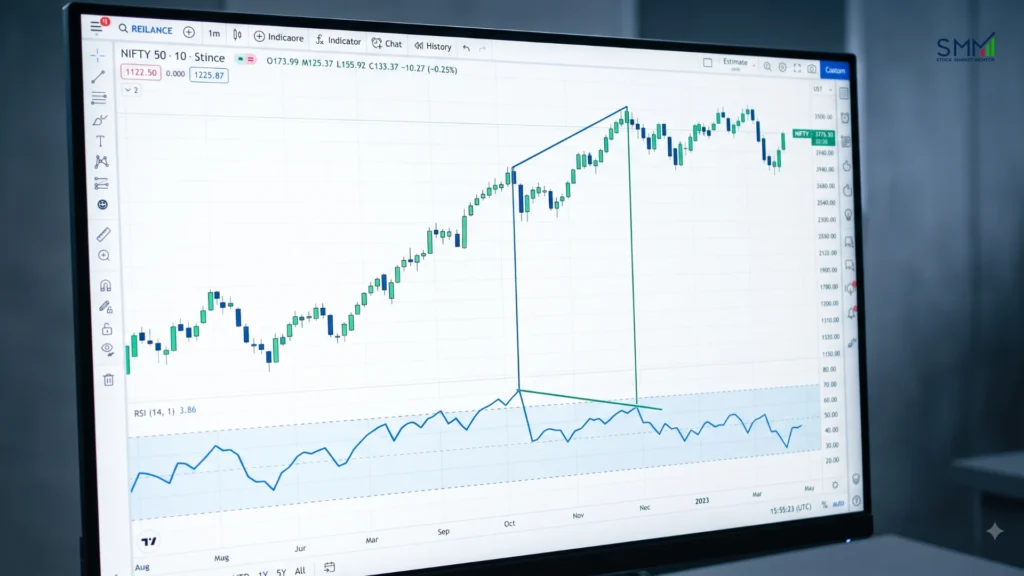
One More Important Concept: RSI Divergence
This is when price and RSI don’t agree. For example:
- Price makes a new high.
- But RSI fails to make a new high.
That often means momentum is weakening. It’s not a guarantee of reversal, but it’s a warning sign worth paying attention to.
What we see in live sessions: In SMM’s Pro Trader Course, students new to RSI consistently treat the 70/30 levels as an automatic entry or exit trigger. When we walk through their charts, the pattern is usually the same, RSI has been above 70 for several sessions while price kept climbing, and the “sell” they took on the first overbought reading cost them the rest of the move. What we ask them to check instead is whether RSI is holding above or below 50 as the trend develops; that’s a more reliable read of whether momentum is still supporting the move.
2. MACD – Understanding Crossover Signals
The Moving Average Convergence Divergence, or MACD, is a momentum and trend-following indicator that uses moving averages to show changes in strength and direction.
The standard MACD setup uses a 12-period EMA, a 26-period EMA, and a 9-period signal line.
How MACD Crossovers Work?
The MACD chart usually has three parts:
- MACD line: Difference between two EMAs.
- Signal line: MACD line smoothed.
- Histogram: Distance between the two lines
The MACD crossover happens when the MACD line crosses over the signal line and is often seen as a bullish indicator of increasing momentum. A bearish crossover is the opposite. If the histogram is widening, the gap between the MACD and Signal line is widening; if the histogram is contracting, the gap is contracting. Traders sometimes take these shifts as signs that momentum is strengthening or decreasing, but read the histogram in context with trend and price structure, not as a separate signal.
The zero line displays whether the shorter-term EMA is above or below the longer-term one. A MACD value above zero indicates that the 12-period EMA is above the 26-period EMA, while below zero signifies the reverse.
However, MACD trading strategies in India should never rely only on crossovers. Since MACD is based on moving averages, it naturally reacts a bit late. In sideways markets, it can also give multiple false signals that don’t lead anywhere.
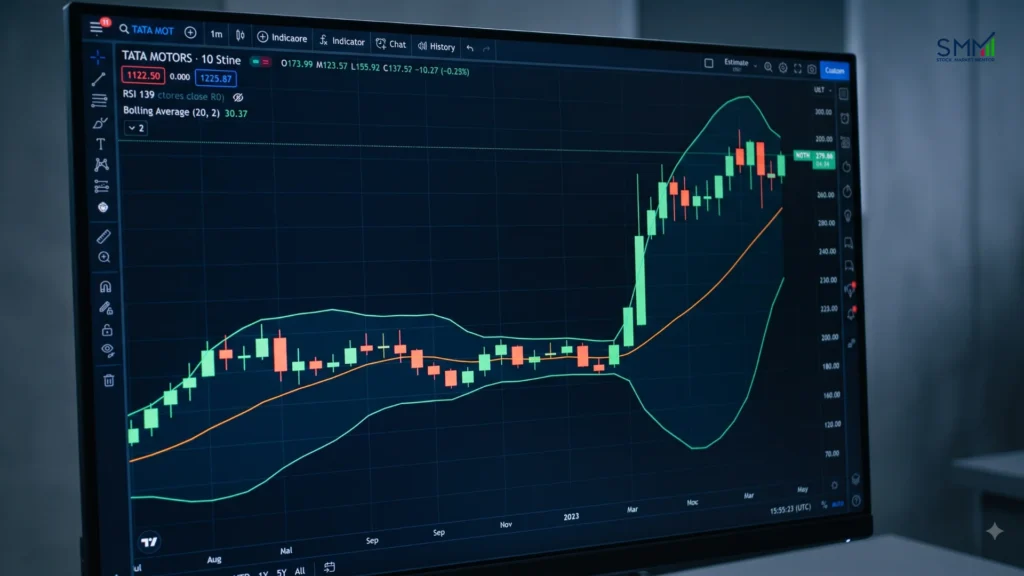
3. Bollinger Bands – Understanding Squeezes and Breakouts
If you want Bollinger Bands explained in a simple way, think of them as a volatility tool.
Bollinger Bands are normally three lines, a central moving average, an upper band, and a lower band. Standard deviation is used to extend and compress the outer bands with volatility. A common setup uses a 20-period moving average and 2 standard deviations.
What Does a Bollinger Band Squeeze Mean?
When the bands come very close together, it means volatility has dropped. This is called a Bollinger Band squeeze.
A squeeze is interesting because low volatility often comes before a big move. But it does NOT tell you the direction of that move.
When volatility returns, the bands expand again. At that point, traders look at price action, volume, support/resistance, and trend to understand what’s happening.
A very common beginner mistake is thinking:
- Price touching the upper band = sell
- Price touching the lower band = buy
That’s not how it works. In strong trends, prices can stay near the upper band for a long time. In strong downtrends, it can stay near the lower band.
4. VWAP – The Intraday Trading Benchmark
VWAP stands for Volume Weighted Average Price. It’s one of the most useful intraday trading indicators because it includes volume in its calculation.
In simple terms, VWAP shows the average price of an asset during the day, but with more weight given to higher-volume trades.
How Traders Read VWAP?
When the price is higher than the VWAP, it is usually considered as evidence of stronger intraday momentum. If pricing is below VWAP, it may be a sign of weaker conditions. Again, this is not a buy or sell indication directly.
Traders usually watch how price behaves around VWAP:
- Does it bounce and move away?
- Does it break through strongly?
- Or does it keep getting rejected?
VWAP is primarily utilized for intraday trading; hence, it is particularly significant for day traders. It helps in recognizing the trend, where the price is and when to execute. It is not meant to replace longer-term tools like the 200 EMA.
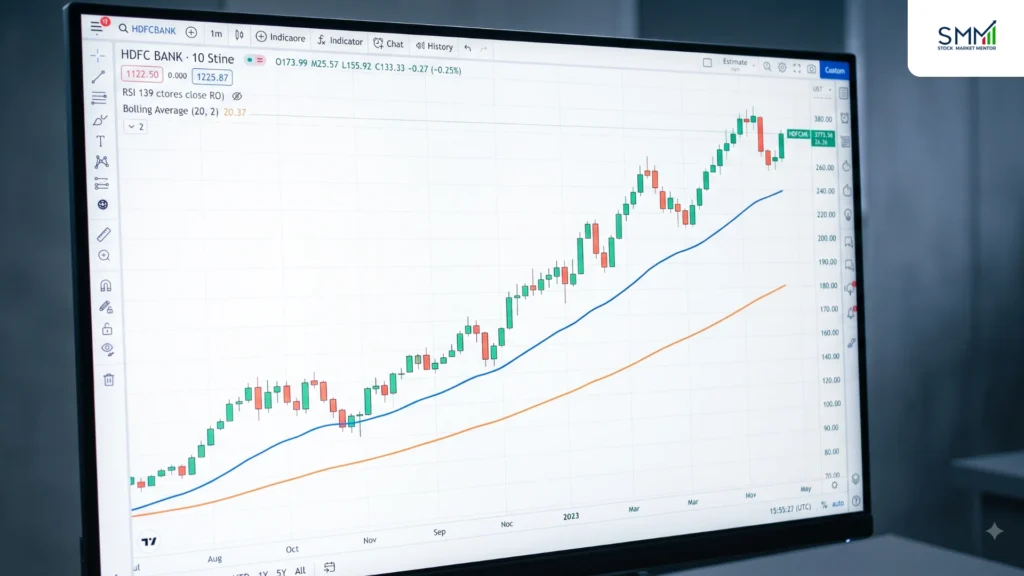
5. Moving Averages – 50 EMA vs. 200 EMA
Moving averages are some of the simplest technical indicators for trading, but they’re also some of the most widely used. They smooth out the price and help you see the trend more clearly.
Two of the most important ones are the 50 EMA and 200 EMA.
The EMA (Exponential Moving Average) gives more importance to recent prices, so it reacts faster than a simple moving average.
What Is the 50 EMA?
The 50 EMA is usually used to understand the medium-term trend. If the price stays above a rising 50 EMA, the trend is generally considered strong. If it stays below a falling 50 EMA, it often signals weakness.
What Is the 200 EMA?
The 200 EMA shows the long-term trend direction. When the price is above an upward 200 EMA, this is a sign of a strong general trend. If the price is trading below a falling 200 EMA, then it is a sign of a weak long-term trend.
50 EMA vs. 200 EMA
Factor | 50 EMA | 200 EMA |
Main role | Intermediate trend | Longer-term trend |
Response | Faster | Slower |
Common use | Shorter/intermediate trend | Broader trend |
Main limitation | More sensitive to noise | More lagging |
How to Combine Technical Indicators for Trading?
One of the biggest beginner mistakes is thinking more indicators = better analysis. But the fact is that too many indicators just repeat the same information and make decision-making tougher. A better way: assign a clear job to each indicator.
Combination 1: RSI + 50 EMA + VWAP
- 50 EMA: Indicates Trend
- RSI: Momentum indicator
- VWAP: Intraday price and volume context
Combination 2: MACD + 200 EMA + VWAP
- 200 EMA: Long-term trend
- MACD: Momentum shifts
- VWAP: Intraday structure
This helps separate big-picture direction from short-term movement.
Combination 3: Bollinger Bands + RSI + VWAP
- Bollinger Bands: Volatility
- RSI: Momentum
- VWAP: Intraday benchmark
Each one looks at a different part of the market, which makes the analysis more balanced.
The simple framework is:
- What is the trend?
- What is momentum doing?
- What are the price and volume telling me?
Worked example: Say a stock is above a rising 200 EMA, price is above the 50 EMA, RSI is above 50, MACD is above its signal line, and price is above VWAP. That’s not five separate confirmations. It’s really trend + momentum + intraday context agreeing, which is a meaningfully different (and stronger) read than five momentum tools all pointing the same way by coincidence. An indicator earns its spot on your chart only if it’s answering a question the others aren’t already answering; that’s the same layering approach Zerodha Varsity recommends for combining technical indicators.
Expert Insight: In SMM’s FNO Champion and Algo Trading Decoded courses, we get students to backtest indicator combinations across trending and range-bound phases before trusting them live. An RSI + Bollinger Band combo that works beautifully in a sideways Nifty can underperform badly the moment the market starts trending.
The SMM 3-Layer Indicator Framework
Most people treat indicators as equals. In practice, we treat them as three layers, not five options to pick from.
- Layer 1: Trend (50/200 EMA): Always check this first. If you learn only one indicator as a beginner, learn this one; it decides which direction you should even be looking to trade.
- Layer 2: Momentum (RSI or MACD, not both): Confirms whether the trend has strength behind it. RSI tends to do this job better in range-bound markets; MACD’s crossovers are more useful once a trend is clearly established. Pick the one your market condition calls for, rather than running both.
- Layer 3: Execution context (VWAP): Intraday only. On swing or positional trades held over several days, VWAP resets every session and stops being meaningful; drop it and lean on the 50 EMA instead.
Where Bollinger Bands fit: they don’t add a fourth layer. They replace Layer 2 when volatility, not momentum, is the open question, such as heading into earnings or during a visible squeeze.

What SEBI's FY26 Data Reveals About Chasing Indicator Signals?
According to SEBI’s comparative study on individual traders in the equity derivatives (F&O) segment, roughly 91% of retail F&O traders lost money in FY25, with aggregate net losses of ₹1,05,603 crore. Government data shared in Parliament showed FY26 losses easing to ₹91,685 crore as fewer people traded, but the average loss per trader still rose to around ₹1.17 lakh.
Why does this matter? Because indicators answer “what is the market doing,” not “how much should I risk finding out.” A trader can read RSI, MACD, and VWAP perfectly and still lose consistently if position sizing, stop-loss discipline, and trade frequency aren’t part of the process.
Three things worth building into your own process:
- An indicator tells you when, not how much. Bollinger Bands might flag a breakout. RSI might confirm momentum. Neither tells you what percentage of your capital that trade deserves.
- Signal quality degrades with overtrading. The more trades you take chasing every crossover, the closer your results tend to drift toward the segment-wide average, and that average is a loss.
- Regulatory context is part of reading the market. SEBI’s 2024-25 measures, rationalising weekly expiries, raising contract sizes, and increasing tail-risk margin, changed how F&O actually behaves intraday. A setup that worked before these changes may not behave identically today.
Do Technical Indicators For Trading Actually Work?
Yes, but only if you understand how to use them properly.
Indicators are based on the market’s prior behavior. They help you to study the price behavior, to spot trends and to calculate the momentum/volatility. But these indications can often be misleading, especially when the market climate shifts.
A 2026 study of adaptive trading reveals that even established approaches can struggle when markets move between different environments.
Common Mistakes Beginners Make When Using Technical Indicators for Trading
Using Too Many Indicators
If multiple indicators are showing the same thing, you’re just repeating information.
Treating Every Signal as a Trade
RSI, MACD, or Bollinger signals should start analysis, not end it.
Buying Because RSI Is Below 30
Oversold can stay oversold in strong downtrends.
Selling Because RSI Is Above 70
Strong trends can stay overbought for a long time.
Trading Every MACD Crossover
Sideways markets can create fake signals repeatedly.
Assuming Bollinger Band Touch = Reversal
Price can stay near bands during strong trends.
Ignoring Risk Management
No indicator protects you from sudden market moves.
Treating Past Results as Guarantees
Markets change; what worked before may not work again.
Technical Indicators Cheat Sheet
Indicator | Measures | Bullish clue | Bearish clue | Main watch-out |
RSI | Momentum | Above 50 / rising | Below 50 / falling | Extremes can persist. |
MACD | Momentum + trend | MACD above signal | MACD below signal | Lags, whipsaws in range-bound markets. |
Bollinger Bands | Volatility | Expansion with upside breakout | Expansion with downside breakout. | A touch isn’t a reversal signal. |
VWAP | Intraday price + volume. | Price above VWAP. | Price below VWAP | Resets each session; not a longer-term tool. |
50/200 EMA | Trend | Price above rising EMA. | Price below falling EMA. | Reacts slowly to new moves. |
Technical Indicators for Trading: Turn Your Chart Confusion Into Clarity with Stock Market Mentor
Knowing technical indicators for trading is easy enough. The harder part is figuring out when they’re actually worth paying attention to.
Most students and working professionals start with RSI, MACD, Bollinger Bands, VWAP, moving averages… and honestly, that’s fine. They do help you make sense of what a chart is doing. But the mistake people make is treating them like signals that always need to “do something” before you act.
And you really don’t need five or six indicators on your screen at once. In fact, that usually makes things worse.
If you’re at the stage where you’re trying to make sense of all this and build some structure around how you read the market, students and working professionals can explore Stock Market Mentor.
Disclaimer: This article is for educational purposes only and is not investment or trading advice.