
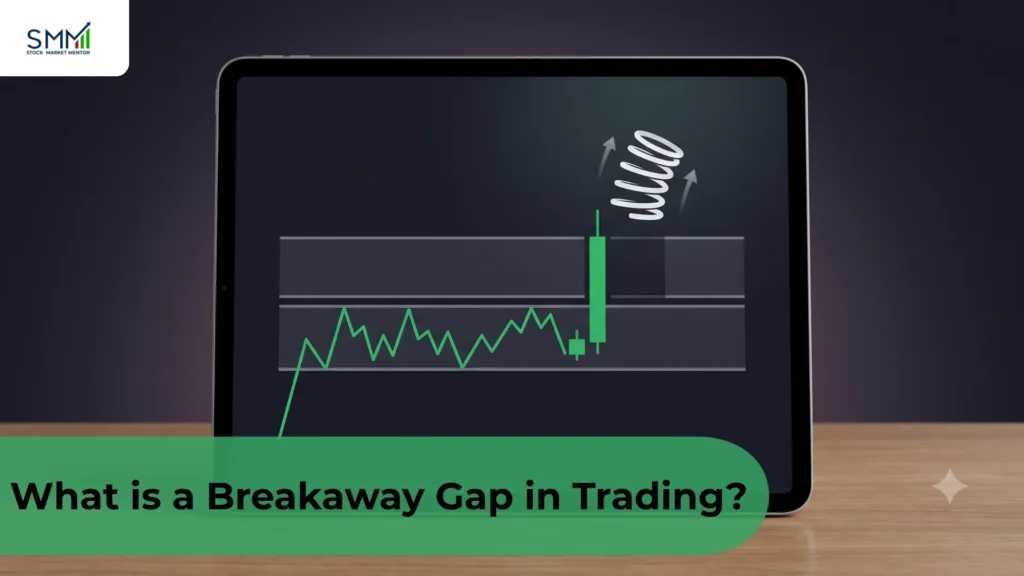
You’re watching a stock that has been stuck between ₹480 and ₹520 for weeks. Nothing much is happening. Then one morning, it opens at ₹545. The price has jumped straight past ₹520, leaving a clear gap on the chart.
Your first thought might be, “Is this the breakout?”
Maybe. But this is where things get tricky. A gap by itself doesn’t tell you much. Some gaps lead to a strong move, while others fade within a day or two and leave traders stuck at a bad entry. The difference usually comes from what happened before the gap and what happens after it.
That’s what makes a breakaway gap worth understanding. In this guide, we’ll look at the consolidation behind the move, support and resistance, volume, the closing price, follow-through, and the signs that tell you when a breakaway gap has failed. Traders looking to build their broader market knowledge can also explore Stock Market Mentor’s stock market courses.
What Is a Breakaway Gap?
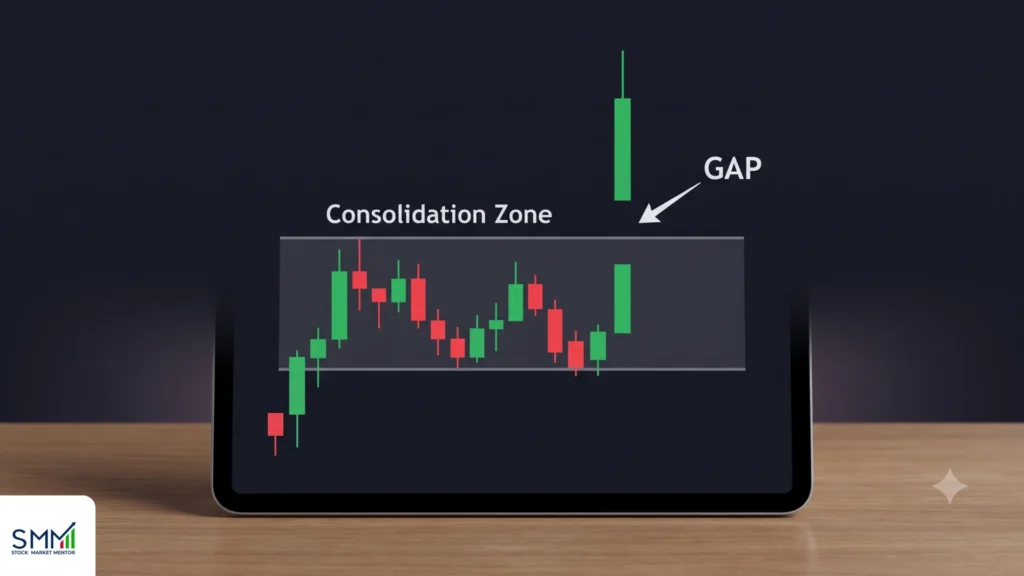
A breakaway gap happens when a stock’s price opens well above or below its previous close, and in doing so, breaks through a support or resistance level that had held for a while. This usually happens after the stock spends time moving sideways, what traders call consolidation.
Picture a coiled spring. Price bounces between a floor and a ceiling for days or weeks. Buyers and sellers are roughly balanced. Then something changes: an earnings beat, a policy announcement, a large institutional order, and the spring releases. Price doesn’t just break the ceiling; it jumps clean over it, leaving a gap on the chart.
The National Stock Exchange’s own investor-education arm, NSE Academy, teaches support and resistance and chart-pattern breakouts as core building blocks of technical analysis.
Traders looking to strengthen their fundamentals can also explore stock exchange learning resources.
Breakaway Gap Up vs Gap Down: What’s the Difference?
- A gap up happens when the stock opens above resistance, a bullish breakaway gap, usually reflecting buying interest strong enough to push past a level that had rejected the stock before.
- A gap down works the other way. The stock opens below support, and it’s a bearish breakaway gap. Selling pressure has overwhelmed the buyers who were defending that level.
Both are read the same way; the direction of the gap tells you which side just took control.
Why Volume Matters (and Where Most People Get It Wrong)?
A lot of people say “high volume confirms a breakaway gap” and leave it there. That’s too vague to be useful.
In a widely cited piece for Stocks & Commodities magazine, hosted by Fidelity’s learning center, trader and analyst Kenneth Gilliland is specific about this: a 10% to 20% bump in volume isn’t enough to matter. He argues the increase needs to be large enough that you can spot it on the volume bars without squinting. The kind of spike that signals substantially broader participation than a marginal increase in activity, not just a few retail orders. High volume is often interpreted as evidence of broader market participation, although volume alone cannot identify which types of participants are responsible. Traders who want to explore volume-based analysis further can learn more about volume profile trading.
That said, the same piece is honest about the exception: light-volume breakouts can succeed. They just fail more often, because there’s no real conviction behind the move. So treat volume as a probability booster, not a pass/fail test.
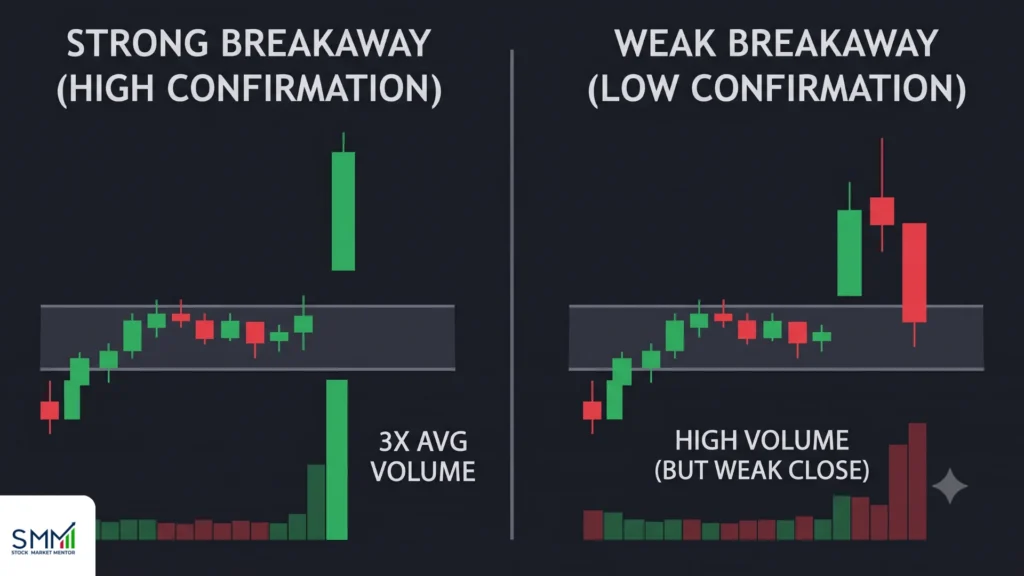
A more accurate rule of thumb: compare the gap-day volume to the stock’s 20-day average. If it’s running two to three times higher, that’s meaningfully elevated. Below that, don’t automatically discard the setup; just size your position smaller and demand more confirmation from price action.
Want to understand how breakaway gaps fit into a broader trading approach?
Why Does the Closing Price Matter in a Breakaway Gap?
It’s not enough for the stock to gap up; where it closes on that first day matters just as much.
Gilliland’s framework flags this directly: ideally, the stock closes near the high of the session on breakout day. A gap that opens strong but gives back most of its gains by the close is a weaker candidate, even if the gap itself looks clean on the chart.
Think of it as the market’s report card for the day. A strong open and a weak close tell you buyers showed up but didn’t stay in control.
Does Gap Size Matter in a Breakaway Gap?
A ₹25 gap means something very different on a stock that normally moves ₹5 a day than on one that regularly swings ₹40. Context matters more than the raw rupee (or dollar) figure.
If you want to get technical about it, compare the size of the gap to the stock’s Average True Range (ATR) over the past 14 days. A gap that’s smaller than the stock’s typical daily range is unremarkable. Compare the gap with the stock’s recent ATR to put its size in context. A gap substantially larger than typical daily volatility is more unusual, but size alone doesn’t confirm that the move will hold. It’s telling you this move is outside the stock’s normal noise. Traders can also review broader resources on technical indicators for trading to understand how ATR and other indicators can be used alongside price action.
Breakaway Gap vs Other Types of Gaps
Gap type | Typical context | Volume | What it usually suggests |
Common gap | Inside an existing range | Ordinary | Limited significance, often fills fast |
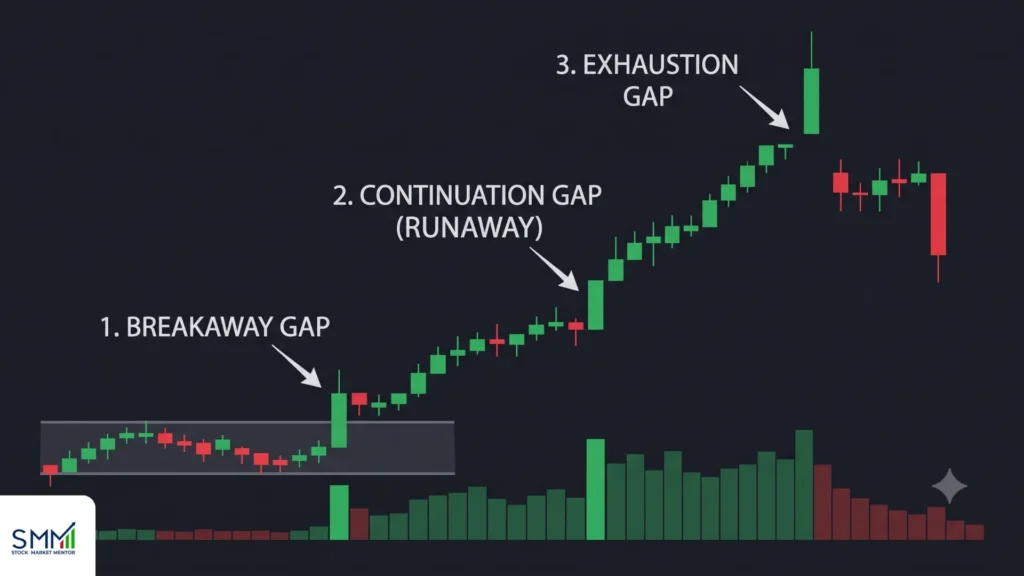
Breakaway gap | Breakout from consolidation | Often well above average | Possible start of a new trend |
Continuation gap | Mid-way through an existing trend | Often elevated | Trend may be accelerating |
Exhaustion gap | Late in a long move | Often fading | Possible loss of momentum |
A continuation gap (also called a runaway or measuring gap) shows up when a trend is already underway. It confirms strength, not something new.
An exhaustion gap shows up after a stock has already run a long way, and instead of fresh momentum, it can mark the last gasp before a reversal.
One useful note: exhaustion gaps tend to come with fading volume, the opposite of what you want to see in a genuine breakaway gap.
The SMM’s 5-Part Breakaway Gap Test
Based on years of observing Indian equities and historical NSE data, here’s a framework by Stock Market Mentor worth actually saving. Don’t judge a gap by the gap alone; judge it by the structure surrounding it.
- Structure: Was there genuine consolidation before the gap, not just a random up day?
- Location: Did the gap break a level that actually mattered (a level tested multiple times), not a minor wiggle?
- Expansion: Is volume meaningfully above the 20-day average, not just marginally higher?
- Acceptance: Did the stock close near its high (for a gap up) rather than fading back?
- Follow-through: Did price hold beyond the broken level over the next few sessions?
A gap that scores well on all five is a much stronger candidate than one that merely “looks like” a breakaway gap on a quick glance. Most failed setups fail on point 4 or 5; they look fine on day one and fail by day three
How to Identify a Breakaway Gap: A Practical Checklist
- Mark the consolidation range: how long has the stock actually been stuck?
- Identify the exact support or resistance level being tested.
- Check whether the open is clearly beyond that level, not just nudging past it.
- Compare gap-day volume to the 20-day average.
- Watch the close: strong or weak relative to the day’s range?
- Track the next 2-3 sessions for follow-through or a fast slide back into the old range.
A Real-World Example
Documented case from an analyst: Arthur Hill, CMT, Chief Technical Strategist at TrendInvestorPro, writing for StockCharts, broke down a Dollar Tree chart that gapped away from its range twice in opposite directions within the same year: a breakaway gap down in November that started a new downtrend, and a breakaway gap up the following May that held for over a week on high volume, signaling a possible sustained advance. It’s a useful real example of a bearish and a bullish breakaway gap on the same stock, months apart.
A genuine Indian-market example: JSW Infrastructure came out of an inverted head-and-shoulders pattern in July 2025, with a bullish gap. The margin has held solid and can be characterized as a breakaway gap, Business Standard said. The example is valuable since the gap was not analyzed in isolation. The surrounding chart pattern and the fact that price held above the breakout were part of the study. For traders interested in validating trading ideas against historical market behavior, backtesting a strategy can provide another way to examine how a setup has behaved across historical data.
How Traders May Approach a Breakaway Gap?
A quick note before this section: this is an educational framework for understanding the pattern, not a recommendation to buy or sell any specific security.
A sound breakaway gap strategy typically follows this sequence:
Confirm Before Entering
Don’t buy purely because a stock gapped up at the open. Give it through the first session, at minimum, to see whether it holds above the broken level.
Choose Your Entry Style
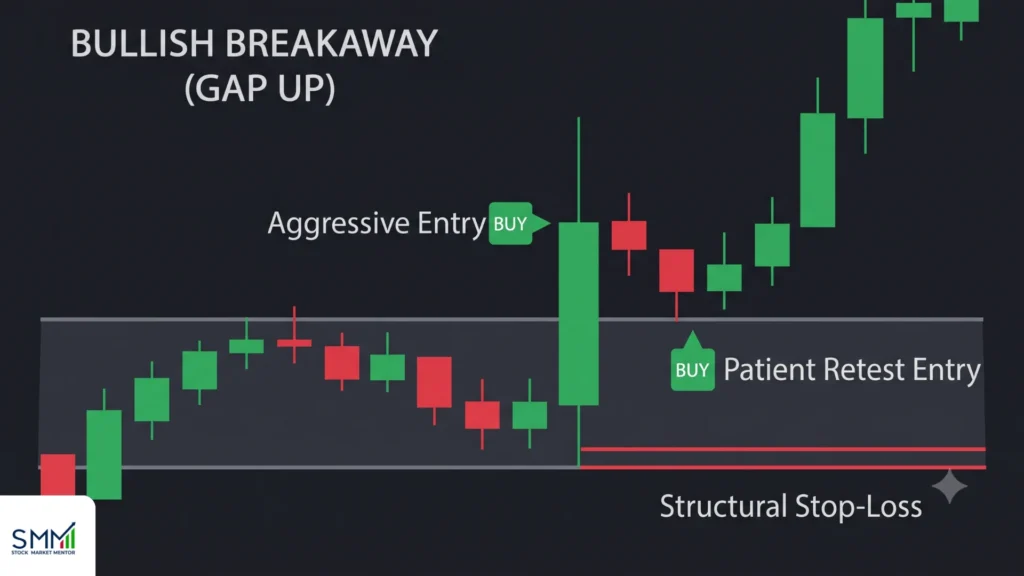
An aggressive trader enters soon after confirmation, accepting more risk for an earlier position. A more patient trader waits for the retest, when price pulls back toward the old resistance-turned-support, often getting a tighter, clearer stop-loss level in exchange for maybe missing the very start of the move.
Anchor Your Stop-Loss To Structure, Not A Percentage
A stop order, sometimes called a stop-loss order, automatically triggers a trade once price hits a level you set, turning into a market order at that point. The US SEC’s own investor-education bulletin is a useful, plain explanation of how these orders actually behave and why the execution price can differ from the trigger price in a fast-moving market. In practice, traders commonly place that trigger just below the intraday low of the breakout day, or just below the top of the prior range if the gap wasn’t far from it. For a bearish gap, mirror this above the structure.
Set Realistic Targets
Look at the next meaningful support or resistance zone, or measure the prior consolidation range and project it forward from the breakout point.
Exit If The Gap Fails
If price closes back inside the old range with real conviction, the setup no longer holds. Don’t argue with the chart.
How to Recognize a Failed Breakaway Gap?
There’s a real difference between a retest and a rejection, and mixing them up costs traders money.
- Valid gap → retest → hold: Price pulls back toward the broken level, touches it, and bounces. This is healthy; it’s the market re-testing the new floor (or ceiling) before continuing.
- Gap → rejection → close back inside the range → failure: Price doesn’t just touch the old level; it pushes through it and closes back inside the prior range. That’s not a retest anymore; the breakout has failed, and the old range is likely back in control.
The distinguishing factor is usually the close, not the touch. A wick that pokes back into the old range and recovers by the close is very different from a candle that closes deep inside it.
Expert Insight (Rohit Sen, Stock Market Mentor)
Traders should learn to read price behavior and market structure themselves rather than lean on tips or calls from someone else. Applied to breakaway gaps, that philosophy is a good filter: the pattern is only useful if you can independently verify the consolidation, the volume, and the follow-through on your own chart, rather than taking someone’s word that “this stock just broke out.” A gap someone else flags for you, without you checking the structure around it yourself, is not the same as a gap you’ve actually confirmed.
What Common Breakaway Gap Mistakes Should You Avoid?
- Calling every gap a breakaway gap: Not every gap is a breakaway gap. Gaps that occur within an established range are generally classified as common gaps. Reserve the term for gaps that break a genuine, tested level after real consolidation.
- Treating volume as binary: It’s not “high volume = valid, low volume = invalid.” It’s a probability scale.
- Chasing price after it has already run far: By the time the gap makes the news, a chunk of the move may be done.
- Assuming the gap will never fill: Some do close eventually. What matters more is whether it fills quickly (a warning sign) or stays open for a while.
- Confusing breakaway gaps with exhaustion or continuation gaps. Where the gap sits within the broader trend decides which one you’re looking at.
- Ignoring the close: A strong open with a weak close is a different animal from a strong open with a strong close.
Breakaway Gap vs Fair Value Gap (SMC/ICT)
A breakaway gap and a Fair Value Gap (FVG) may look similar on a chart, but they come from different trading frameworks. A breakaway gap is a classical technical analysis concept linked to a breakout through established support or resistance. FVG is mainly used in SMC/ICT-style trading to describe a price imbalance created during a strong move.
Breakaway Gap | Fair Value Gap | |
Focus | Breakout from a range | Price imbalance |
Framework | Classical technical analysis | SMC/ICT |
Key clue | Gap through support/resistance | Three-candle imbalance |
Main question | Did price break the structure? | Will price revisit the imbalance? |
The important point is simple: an FVG is not automatically a breakaway gap. Keep the two concepts separate when analysing charts. For classical technical-analysis basics, see CME Group’s Technical Analysis course.
Breakaway Gap: What Should You Look For Next?
A breakaway gap can catch your eye, but don’t let the gap alone make the decision. Check the range it broke out of, the volume behind the move, where the stock closed, and whether it holds over the next few sessions. That kind of independent chart reading is also part of the learning approach at Stock Market Mentor. So, when you spot the next gap, take a closer look at the chart first. The price action may tell you more than the gap ever could.