You open your trading chart, looking for a clean setup. RSI is telling you the market is overbought. MACD is doing its own thing. Moving averages are crossing and uncrossing like they can’t make up their mind. And now you’re stuck. Do you trust one signal over the other? Most of the time, you end up waiting… and by the time everything “confirms,” the move is already gone.
That’s usually the moment traders start looking into price action trading.
Instead of cluttering your chart with indicators that often disagree with each other, price action keeps things simple. You just focus on what the market is actually doing. Are we making higher highs or lower lows? Where is the price reacting strongly? Did it break a key level or just sweep liquidity and reverse? These are the kinds of clues that actually show you what’s going on in real time.
But let’s be honest, trading without indicators doesn’t mean trading without structure. You still need a way to read the market properly.
Why this matters more in 2026: According to the Securities and Exchange Board of India’s own analysis, presented by the Ministry of Finance in the Rajya Sabha on August 11, 2026, individual traders in the equity Futures & Options segment lost a combined ₹91,685 crore in FY26, and the average loss per trader actually rose to ₹1,16,654, even as nearly 20% of participants exited the segment. That single statistic is the best argument for structure over guesswork that exists in the Indian market today: the traders who lose the most are consistently the ones without a repeatable process, not the ones missing an indicator. (Source: SEBI-based data cited in Parliament, reported via Business Standard; underlying regulator methodology at SEBI’s official study, sebi.gov.in.)
In this blog, we’re going to break down everything step by step: market structure, supply and demand, liquidity, BOS and CHOCH, order blocks, fair value gaps, and how to actually plan entries, exits, and manage risk without overcomplicating things.
What Is Price Action Trading?
Price action trading simply means you make your trading decisions by watching how price actually moves on the chart, instead of relying heavily on indicators like RSI, MACD, or moving averages.
The idea is: instead of waiting for an indicator to tell you what already happened, you read the price itself.
Every candle already shows open, high, low, and close. From just that, you can understand trends, swing highs and lows, breakouts, rejections, and areas where buyers or sellers stepped in.
Now, this doesn’t mean indicators are useless. They can still help. The problem starts when a trader keeps stacking indicators one after another, hoping for “perfect confirmation.” At that point, the chart becomes noise.
Price Action vs Indicator-Based Trading
Indicators are just calculations based on price data. Price action is the direct reading of that same data.
For example, a moving average might show you the overall direction. But a price-action trader will simply look at whether the market is making higher highs and higher lows. Neither method guarantees success.
Price and Volume
Some traders prefer working with just price & volume.
- Price tells you where the market is going.
- Volume tells you how much participation is behind that move.
A strong move with strong volume usually carries more weight than a weak move with low participation.
But volume is not a magic confirmation tool. At the end of the day, price is still the main story. If you want to understand how these tools work, see our guide to technical indicators for trading.
Market Structure: The Foundation of Price Action Trading
Before you even think about entries, you need to understand one thing: what is the market actually doing?
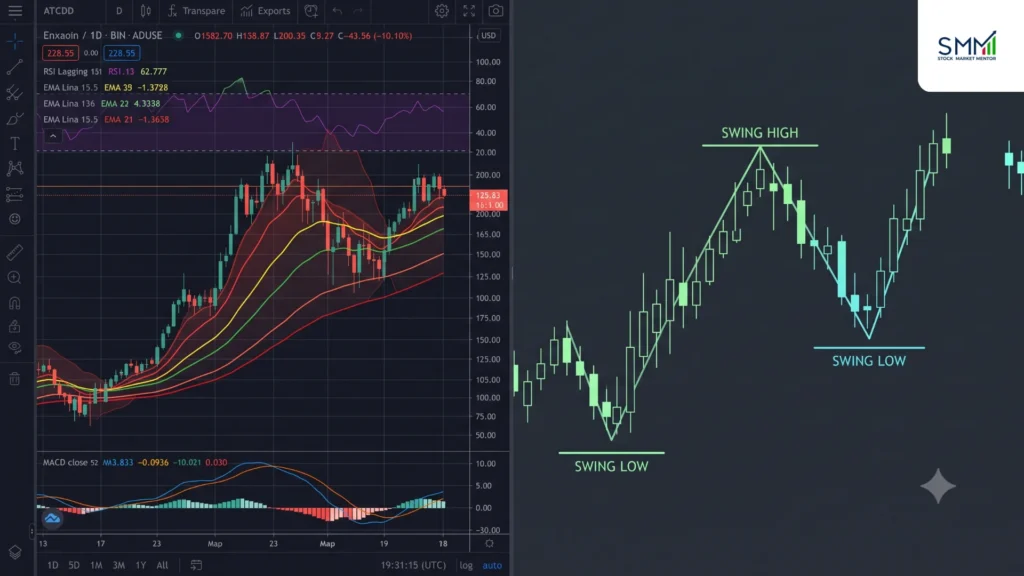
Understanding Highs and Lows
An uptrend usually looks like:
Higher High → Higher Low → Higher High → Higher Low
A downtrend looks like:
Lower Low → Lower High → Lower Low → Lower High
These swing points are the base of everything:
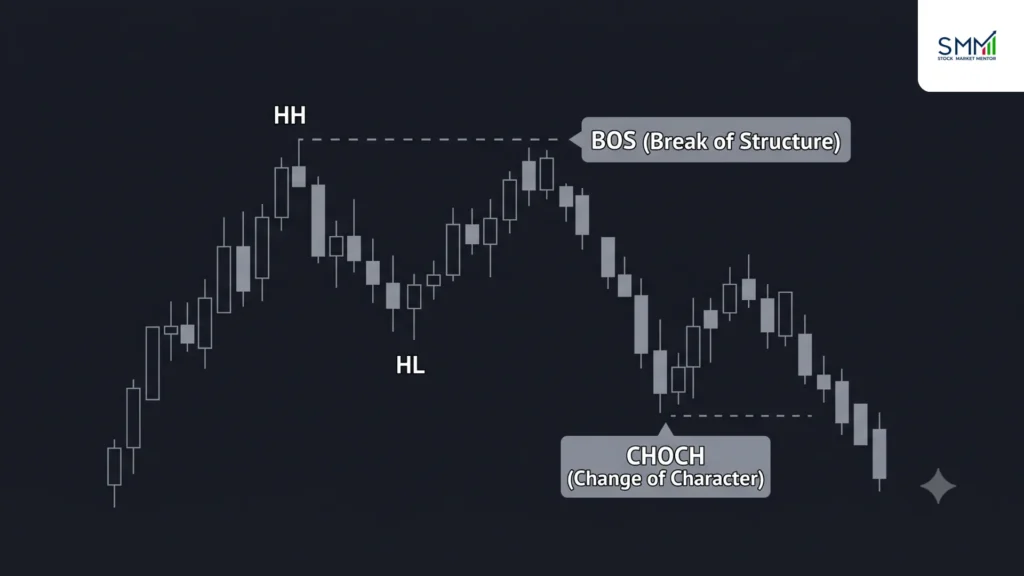
Market structure – highs, lows, BOS, CHOCH
If price keeps making higher highs and higher lows, buyers are in control. If that structure starts breaking, something is changing.
That’s why structure always comes before entries. A bullish candle alone means nothing if you don’t know where it sits in the bigger picture.
Trending vs Ranging Markets
Markets don’t trend all the time.
- In a trend, price moves in one direction with clear swings.
- In a range, price moves sideways between two zones.
Setups to follow trends function better in trending markets. Reversal setups are particularly important toward the range extremes.
What Is Break of Structure (BOS)?
A Break of Structure (BOS) occurs when price breaks a substantial swing in the direction of the trend.
- Uptrend: break previous high = bullish BOS.
- In a downtrend: breaking of the last low = bearish BOS.
BOS is mostly about continuity, rather than reversal. BOS is still considered a part of the overall structural system even in current 2026 SMC concepts.
What Is CHOCH?
Change of Character (CHOCH) is used to describe a possible shift in behaviour.
For example: If the market is making higher highs and higher lows, and suddenly breaks a key higher low, that may be a CHOCH.
But here’s the important part:
CHOCH is not a guarantee of reversal. It’s just a clue. The market still needs to confirm it. For readers who are completely new to the market, the stock market for beginners resource can provide a starting point before moving into more advanced price-action concepts.
Demand & Supply Zones vs Support & Resistance
These concepts are similar, but traders use them a bit differently.
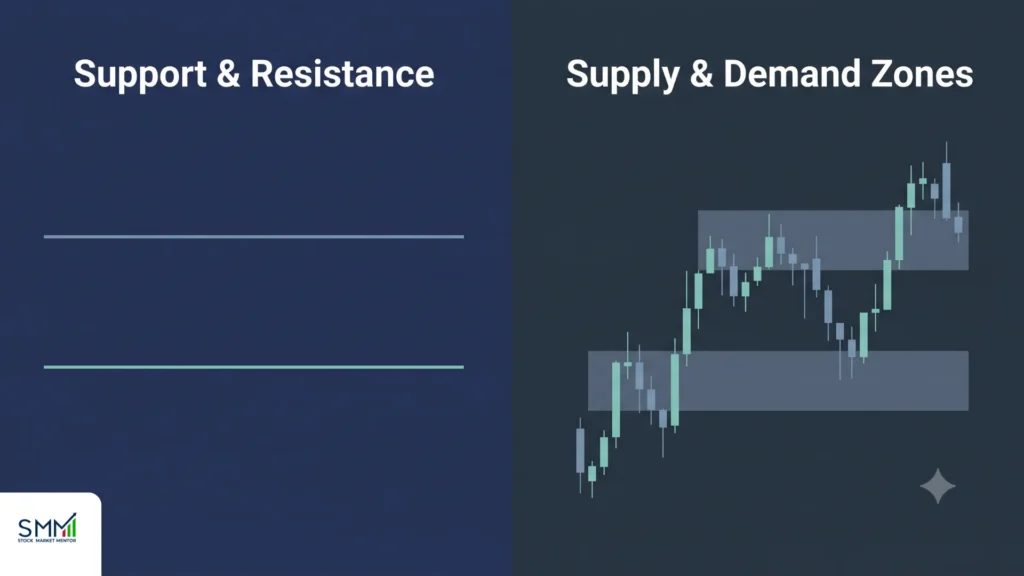
What Are Demand and Supply Zones?
- Demand zone = area where strong buying pushed the price up.
- Supply zone = area where strong selling pushed the price down.
The key idea is not a single price; it’s an area of reaction.
Example: If price drops into a zone and then shoots up strongly, that area becomes a potential demand zone.
What Are Support and Resistance?
- Support = area where price previously found buying.
- Resistance = area where price previously faced selling.
These are often based on visible highs and lows.
Traditional traders focus on levels. Supply-demand traders focus more on the origin of strong moves.
But in both cases, the rule is the same: Don’t blindly buy support or sell resistance.
A better flow is: Mark area → Wait → Watch reaction → Confirm → Decide
Demand/Supply vs Support/Resistance
Include a short comparison:
Demand & Supply | Support & Resistance |
Often viewed as zones | Often marked as levels/zones |
Focuses on strong buying/selling areas | Focuses on previous reactions |
Common in SMC/price action | Common in traditional technical analysis |
Uses price behaviour and displacement | Uses previous highs/lows and reactions |
Liquidity in Price Action Trading
Liquidity is a concept used a lot in modern price action and SMC trading. In simple terms, liquidity is where orders are likely sitting, usually around:
- Previous highs
- Previous lows
- Equal highs
- Equal lows
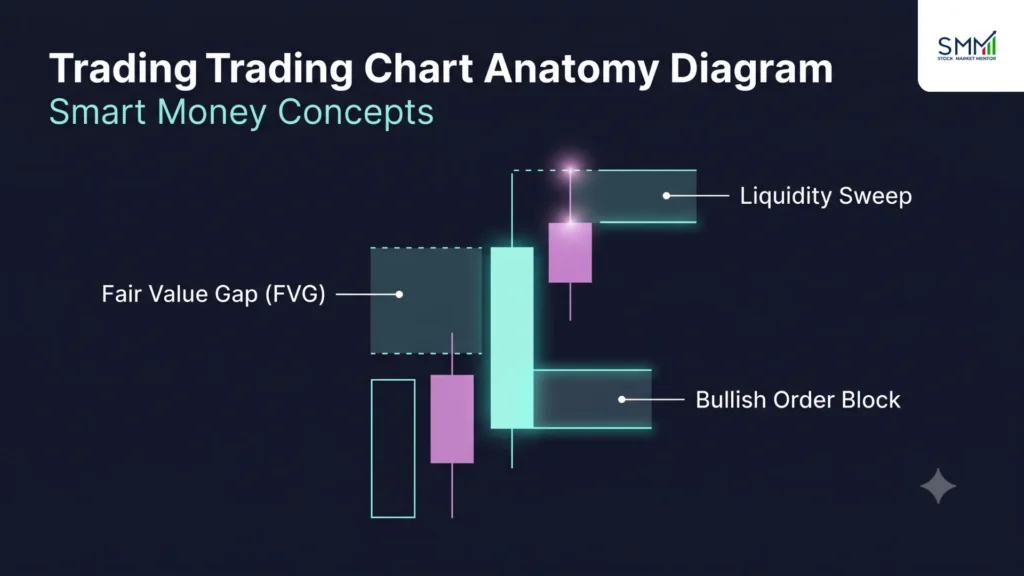
For example: If price forms two equal highs, traders expect attention there. Price may move above it, trigger stops or breakouts, and then reverse. This is often called a liquidity sweep.
But don’t assume every move above a high is manipulation. It’s just price behaviour. You have to read it in context.
A liquidity sweep followed by rejection + structure shift is what actually matters.
Order Blocks: Understanding Institutional Footprints
Order blocks are a popular idea in Smart Money Concepts.
In simple words, an order block is usually the last opposite candle or consolidation before a strong move.
Example: Price consolidates → then explodes upward → breaks the structure.
That consolidation area becomes a bullish order block.
The same logic applies in reverse for bearish moves.
But remember: An order block is not proof that institutions placed orders there. It’s just a way of marking important price reaction zones.
How to Trade an Order Block?
A simple process:
- Identify structure
- Find strong displacement
- Mark order block area
- Wait for price to return
- Look for confirmation
- Define entry + invalidation
- Set target using structure
Don’t mark every candle as an order block. If everything is an order block, nothing is.
Fair Value Gaps: How to Trade Them?
A Fair Value Gap (FVG) is an imbalance created during a strong 3-candle move.
The idea is simple: The price moved too fast, leaving an “empty zone” behind.
- Bullish FVG = strong upward move
- Bearish FVG = strong downward move
How to Trade a Fair Value Gap?
Keep it simple:
Market structure → Displacement → Identify FVG → Wait → Confirm → Enter → Invalidate
Common mistake: treating every FVG as a trade. Context matters. A bullish FVG inside a strong bearish trend is not automatically a buy. Also, not every FVG gets filled. Some do, some don’t, some get ignored completely.
How to Enter a Trade Using Pure Price Action?
A proper entry process should always be structured.
Start with:
- Market structure
- Key supply/demand or liquidity zone
- Wait for the price to reach it
Then observe:
- Rejection
- Engulfing move
- BOS
- CHOCH
- Liquidity sweep
- Displacement
- Retest
- Order block reaction
- FVG interaction
But don’t enter just because one candle looks good.
A better rule is Context + Structure + Location + Confirmation = Trade Setup. And always define your stop before entry.
Expert Insight from Rohit Sen (Founder of Stock Market Mentor): The traders who struggle most with price movement don’t misread chart patterns; they don’t define ‘wrong’ before entering. Pattern-recognition tools BOS, CHOCH, and order blocks direct you. They won’t tell you how much to invest in a concept or when to give up. Stock Market Mentor students who journal their invalidation level and position size before their entering rationale develop best. One behavioral change improves consistency more than any other pattern.
The SMM 5C Trade Filter: A Proprietary Framework for Grading Your Own Setups
The harder part is honestly grading a setup before risking capital on it. At Stock Market Mentor, students score every discretionary setup on five factors, 0–2 each, before entry:
Factor | Question | Score |
Context | Aligned with the higher timeframe? | 0–2 |
Confluence | More than one independent reason lining up? | 0–2 |
Confirmation | Has price actually reacted, or are you hoping it will? | 0–2 |
Capital at risk | Size set by your stop-loss, not your target profit? | 0–2 |
Conviction | Could you take the next trade calmly if this one failed? | 0–2 |
How to Set Stop-Loss and Take-Profit Using Price Action?
Your stop-loss should be placed where your idea becomes wrong.
- If buying from demand → stop below invalidation.
- If selling from supply → stop above invalidation.
Targets should come from price itself:
- Previous highs/lows
- Opposing zones
- Liquidity areas
- Major support/resistance
- Structural levels
Don’t force a 1:3 RR if the market doesn’t support it. And position size should always depend on risk.
Illustrative Price Action Walkthrough (Not a Live Trade Record)
This is a hypothetical Nifty walkthrough to show how the concepts above connect. It isn’t a screenshot of an actual executed trade with real dates and prices. We’re working on adding a genuine, annotated trade review from our own journal in a future update; for now, treat this as a teaching example, not a case study.
Higher time frames show an uptrend: higher highs and higher lows. Price pulls back into a demand zone. Instead of buying immediately, you wait. Price dips below a recent low, a liquidity sweep. Then it quickly moves back up, a structure shift (CHOCH). A strong bullish move creates an FVG, and an order block forms nearby.
Now the setup looks like this:
- Trend: Bullish
- Location: Demand zone
- Liquidity: Swept
- Confirmation: CHOCH / structure shift
- Entry: Order block or FVG retest
- Stop: Below invalidation
- Target: Previous high / liquidity
The key point is you didn’t guess. You waited for a reaction. If price breaks demand and continues down, the idea is simply invalid.
Price Action in the Algo Era: What SEBI's 2026 Framework Means for Discretionary Traders?
In February 2025, SEBI mandated that every retail-facing algo strategy, in-house or third-party, be broker-registered, exchange-tagged with a unique Algo ID, and, if “black box,” backed by a SEBI-registered Research Analyst. SEBI circular Full applicability across all brokers began April 1, 2026, after two timeline extensions.
Why it matters even if you’ll never code: more of the order flow you’re reading is now systematic and disclosed, not mysterious “smart money” folklore. And if you ever automate your own BOS/CHOCH or FVG rules, check with your broker first, once your logic starts placing orders through an API instead of your hand, it may fall under this framework depending on order speed, and registration isn’t optional at that point.
This isn’t a reason to avoid systematizing your rules, it’s a reason to do it inside a regulated structure instead of an informal one.
Learn Price Action Course in Noida the Structured Way
A lot of traders try to piece this together from YouTube and random posts, and it usually doesn’t connect. BOS, CHOCH, liquidity, order blocks, and FVGs are learned as separate tricks instead of one system. Structured investor education helps here too: NISM (SEBI’s own institute) runs a free Investor Certification Examination, and SEBI publishes its own Investor Education material; both are worth a look regardless of where else you learn, just as a baseline check on any strategy claims you run into.
If you’re in Delhi NCR and want a guided, connected path rather than scattered videos, Stock Market Mentor’s Noida-based courses cover price action, support and resistance, demand and supply, chart reading, risk management, and live market practice together.
Does Price Action Trading Actually Work?
Honestly, it’s not a guaranteed edge, and no honest guide should claim it is. Price action is a method of reading the market, not a trade-winning strategy. Two traders can look at the exact same chart and perceive it differently; that’s the compromise you accept when you ignore indicators for judgment. It works best when combined with real screen time, an established methodology, and tight risk management. It does not function if you use it to justify entries you meant to take anyway before you saw the chart.
If you want a strategy that eliminates all of the decision-making out of the equation, price action is not it. If anything, price action requires more discipline than indicator-based trading, not less. When a transaction goes bad, you can’t blame a signal.
Common Price Action Trading Mistakes
Let’s keep it real.
- Treating BOS as an automatic entry.
- Thinking CHOCH guarantees reversal.
- Marking too many zones (order blocks / FVGs).
- Ignoring higher timeframe structure.
- Chasing breakouts after the move is done.
- Moving stop-loss to avoid loss.
And the biggest one: Thinking price action removes uncertainty. It doesn’t. No BOS, CHOCH, order block, or FVG guarantees anything.
Understanding Price Action Trading With Stock Market Mentor
Price action trading isn’t really about hunting for some “perfect” signal on a chart. It’s more about slowing down and actually understanding what the market is doing in front of you.
Of course, this is not an overnight thing. It requires screen time, practice and a little bit of guidance at the beginning. If you want to create that foundation in a more systematic fashion, then Stock Market Mentor is here to help you with practical trading courses in Noida that teach you about price action, chart reading, entries, exits, and risk management. For traders who are looking for a guided learning path in this regard, the Pro Trader course at SMM in Noida could be a structured next step.
Disclaimer: This article is for educational purposes only and does not constitute investment or trading advice.