

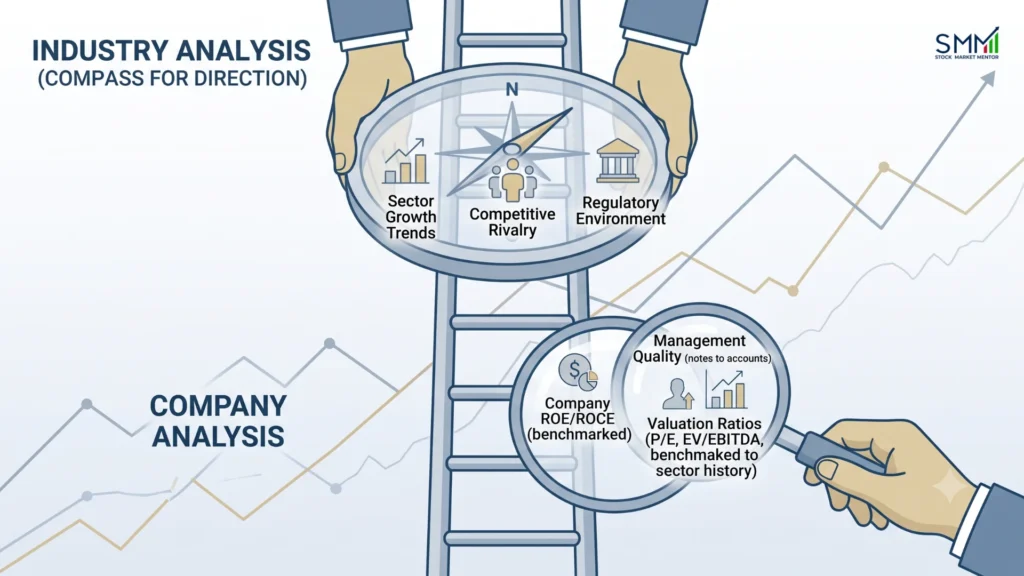
You find a company that looks good on paper. Revenue is growing, profits are up, and the stock looks interesting. Naturally, you start checking its P/E ratio, debt, and balance sheet. But there’s a question that often gets pushed aside: what is happening in the industry this company operates in?
That question can change how you read everything else. Say a company’s revenue has grown 12% over the year. Sounds good, right? Not if the industry grew 20% during the same period. The company may actually be losing ground while looking healthy on its own.
This is why industry analysis should come before company analysis. It gives you the bigger picture: market growth, competition, profitability, regulation, and risks, before you decide how well a company is performing. If you’re new to investing, it also helps to understand the broader fundamentals covered in our stock market for beginners guide before diving into individual companies.
In this blog, we’ll break down how to analyze an industry and then use that information to understand the company you’re considering.
Why Does Industry Analysis Come First?
A great company in a shrinking industry is still a bad bet. A mediocre company in a booming industry can outperform for years just by riding the wave.
A company’s numbers only mean something next to its peers and its sector’s growth rate. 12% revenue growth sounds solid, until you learn the whole sector is growing at 20% and your company is quietly losing ground. That’s what industry analysis gives you: the baseline everything else gets measured against.
How to Conduct an Industry Analysis: A Practical Framework
Step 1: Conduct an Industry Analysis
What Is An Industry Analysis, Exactly?
Before you can analyze an industry, you need to know where its boundaries sit, and that’s less obvious than it sounds. Is a company that sells both paints and chemicals a “paints” company or a “chemicals” company? Where does “fintech” end and “banking” begin?
India actually has an official answer to this. NSE Indices and BSE jointly run a four-tier classification structure: Macro-Economic Sector, Sector, Industry, and Basic Industry, covering 12 macro-economic sectors, 22 sectors, 59 industries, and 197 basic industries. Companies are slotted in based on which business segment brings in more than half their revenue. This is the same classification NSE and BSE both use, so it’s a genuinely useful starting point when you’re trying to find a company’s real peer group instead of guessing. You can look up the full structure directly on NSE’s industry classification page.
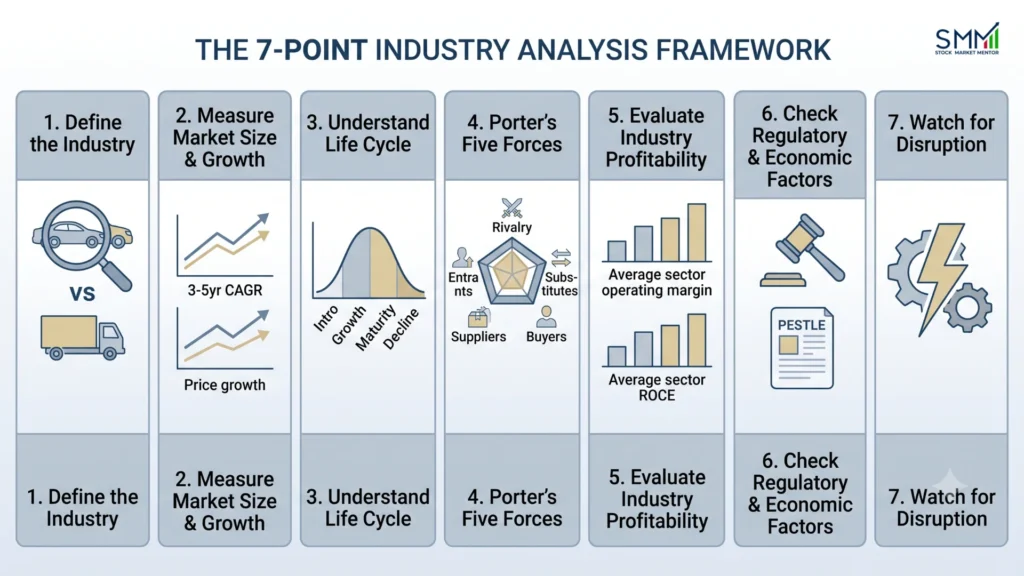
The 7-Point Industry Analysis Framework
- Define the industry
Get specific. “Auto” isn’t one industry: passenger vehicles, commercial vehicles, and two-wheelers all run on different demand cycles. Use NSE’s classification (above) to check whether you’re comparing a company to its actual peer group or to companies that just sound similar.
- Measure market size and growth
Don’t just ask “is this industry growing?” Ask why. Growth driven by higher volumes is a different story than growth driven purely by price hikes. One tells you demand is real; the other tells you customers are paying more for the same thing. Look at 3-5 year CAGR, not just one good year.
- Understand the industry life cycle
Every industry moves through Introduction → Growth → Maturity → Decline, and the stage changes what matters:
- Growth stage: companies compete to capture market share, often burning cash to do it.
- Maturity stage: competition shifts to efficiency and pricing discipline; market share gains get much harder.
- Decline stage: some companies continue to earn profits, but their growth assumptions require much closer analysis than the figures presented.
- Analyze the competitive landscape with Porter’s Five Forces
Force | What to actually look for |
Rivalry among existing players | Number of major competitors, price wars, market-share shifts |
Threat of new entrants | Capital needed to enter, licensing/regulatory hurdles, distribution access |
Threat of substitutes | Alternative products or technologies customers could switch to |
Supplier bargaining power | How concentrated suppliers are, dependency on key inputs |
Buyer bargaining power | Customer concentration, how easily they can switch |
- Evaluate industry profitability
Check average operating margins, gross margins, and sector-wide ROCE. Capital-intensive industries (steel, telecom) behave very differently from asset-light ones (IT services. A “low margin” in one industry can be perfectly healthy in another.
- Check regulatory and economic factors
A quick PESTLE scan: Political, Economic, Social, Technological, Legal, Environmental, catches what Five Forces misses. A single regulatory circular can reshape an entire sector’s economics overnight (more on this in the red-flags section below).
- Watch for disruption
Ask what technology or business model could make the current leaders irrelevant. The industry structure that looks stable today is rarely the one that existed ten years ago.
Industry Analysis vs. Company Analysis: What’s the Difference?
These get mixed up constantly, so here’s the split:
Industry analysis | Company analysis |
Market size and growth | Revenue and revenue growth |
Competitive intensity | Competitive positioning within that landscape |
Industry-wide margins | Company-specific margins |
Regulatory environment | Governance and compliance record |
Sector ROCE | Company ROCE |
Industry-level risks | Company-specific risks |
Industry analysis tells you whether the playing field is attractive. Company analysis tells you whether this particular player is positioned to benefit from it.
Real-World Example: Reading India’s Banking and NBFC Industry in 2026
RBI’s sectoral credit data for July 2026 shows non-food bank credit growing 19.1% year-on-year, compared with just 9.9% growth in the same period a year earlier. Earlier in the year, January 2026 data showed credit to industry itself growing 12.1% y-o-y versus 8.3% the year before, with infrastructure, engineering, chemicals, and textiles among the industries showing the most resilient growth.
What does an investor actually do with that? Walk it through the framework:
- Growth: Credit growth accelerating this sharply signals rising demand across the borrower base, a tailwind for lenders, provided asset quality holds up.
- Competition: Within banking, growth isn’t spread evenly. NBFCs and private banks have been gaining share in segments like personal loans and commercial real estate lending, which changes who benefits most.
- Regulation: This is a heavily regulated industry, so RBI’s monthly data itself becomes a genuine leading indicator, not just a rearview number.
- Company positioning: A bank or NBFC growing credit slower than this industry-wide rate is losing relative ground, even if its own growth number looks fine in isolation.
That’s the difference between “the lending industry is growing” and knowing where and why it’s growing, which is what turns industry analysis from trivia into something you can actually act on. You can pull this data straight from RBI’s Sectoral Deployment of Bank Credit releases each month; it’s free and updated monthly.
Compare the Right Industry-Specific KPIs
Comparing a bank on inventory turnover, or a retailer on NIM, tells you nothing. Match the KPI to the industry first. Different industries run on different economics:
- Banks/NBFCs: NIM, GNPA/NNPA, CASA ratio, credit growth, provision coverage.
- Retail: Growth in same-store sales, revenue per store and inventory turnover.
- IT services: Usage, attrition, revenue per employee, deal win momentum.
- Manufacturing: Capacity utilization, volume growth, realizations, input-cost trends.
Step 2: Study the Business and Its Competitive Positioning
Once the industry makes sense, zoom into the company. Write down, in two or three plain sentences, what it sells, who buys it, and why those customers stick around instead of switching. If you can’t do that, you don’t understand the business well enough yet.
Then check its competitive positioning: brand strength, cost advantage, distribution reach, and switching costs, against direct competitors. That comparison tells you whether the company leads its industry or just survives in it. For investors who want to understand how market activity can be evaluated alongside company fundamentals, it can also help to understand broader trading strategy in India.
Step 3: Go Through the Annual Report and Financial Statements
An annual report is the most detailed, audited account of how a company actually performed. Focus on three statements:
- Balance sheet: debt levels, cash reserves, and how both have moved over 3–5 years
- Income statement: revenue, operating profit, net profit; growth with shrinking margins is a warning, not a win
- Cash flow statement: the one most investors skip. Profits can rise on paper while actual cash flow deteriorates because of unpaid customer bills or aggressive accounting
Read the notes to accounts and management discussion sections too. That’s usually where related-party transactions and honest commentary on challenges actually show up.
Step 4: Check profitability with ROE, ROCE and ROIC
- ROE: Earnings on shareholders’ money.
- ROCE: returns on both equity and debt combined, useful for capital-heavy businesses.
- ROIC: strips out excess cash to show how well the core business converts capital into profit.
None of these mean much alone. A 15% ROE looks strong until you learn the sector average is 22%. Always benchmark against direct competitors and the company’s own five-year history.
Step 5: Value the Stock – P/E, P/B, and EV/EBITDA
- P/E ratio: how much investors pay per rupee of profit
- P/B ratio: useful for asset-heavy businesses like banks and manufacturers
- EV/EBITDA: a cleaner comparison across companies carrying different debt loads
It’s not the number, it’s context. The Nifty 50’s trailing P/E in mid-2026 was around 20.2, below its long term average of around 22.5, a reminder that even a broad market P/E has to be read in the light of its own history. Same thing with every stock: compare it to its own historical levels, to close competitors, not some random number someone randomly threw out there.
Step 6: Watch for Red Flags
- Rising debt paired with falling interest coverage.
- Revenue growing while cash flow shrinks.
- Heavy promoter share pledging, or unexplained related-party transactions.
- Sudden CFO or management exits with no clear reason given.
Regulatory disclosures are actually your friend here. SEBI’s disclosure norms now require listed firms to share granular royalty payment data, including IP fees and cross-entity rates, with audit committees and shareholders, and SEBI has published its own research specifically studying royalty payments made by listed companies to related parties.
Separately, shareholding-pattern filings now require companies to disclose non-disposal undertakings and the total shares pledged or otherwise encumbered. Both changes give retail investors more visibility into exactly the kind of hidden risk that used to slip through the cracks. You can browse these filings directly on SEBI’s corporate filings portal and SEBI’s royalty-payments research study.
Common Mistakes When Doing Industry Analysis
- Looking only at industry growth, ignoring who’s actually capturing it.
- Confusing overall market growth with one company’s growth.
- Based on old industry data, not the data from the last quarter.
- Comparing companies with distinct core business models.
- Forget about how regulation can change economies overnight.
- Assuming market share is a trench and not something that can change.
- Applying one set of ratios to each industry regardless of fit.
Expert Insight (Rohit Sen, Stock Market Mentor):
The mistake we see most often among newer investors isn’t a wrong ratio. It’s skipping the industry step entirely and jumping straight to a stock tip. Our Value Investor course spends its first sessions purely on sector positioning before touching a single financial ratio, for exactly this reason: a company’s numbers only make sense once you know what “good” looks like for its industry. If you’re building this habit from scratch, start by picking one industry you already understand from daily life and running it through the framework above before you ever open a stock’s balance sheet.
Follow the Money: Where Does the Industry's Growth Actually Go?
Here’s something people skip: an industry can grow fast and still not make its companies richer.
Say an industry grows from ₹1 lakh crore to ₹1.2 lakh crore. Nice. But where did that extra ₹20,000 crore actually go? Into profits? Into discounts and ad spend? To suppliers charging more? Or mostly to the top two players?
So don’t just stop at “it’s growing.” Ask these:
- Who’s paying for the growth? More buyers, or just higher prices?
- Who’s keeping the extra money? Companies, suppliers, distributors, or customers?
- Are margins moving with revenue? If sales rise but margins don’t, something is soaking up the gains.
- Is everyone sharing it? Check market-share shifts.
- What if growth slows? Firms spending heavily today could get exposed fast.
So next time, skip ‘Is the industry growing?’ and ask ‘Who’s actually getting richer because of it?’
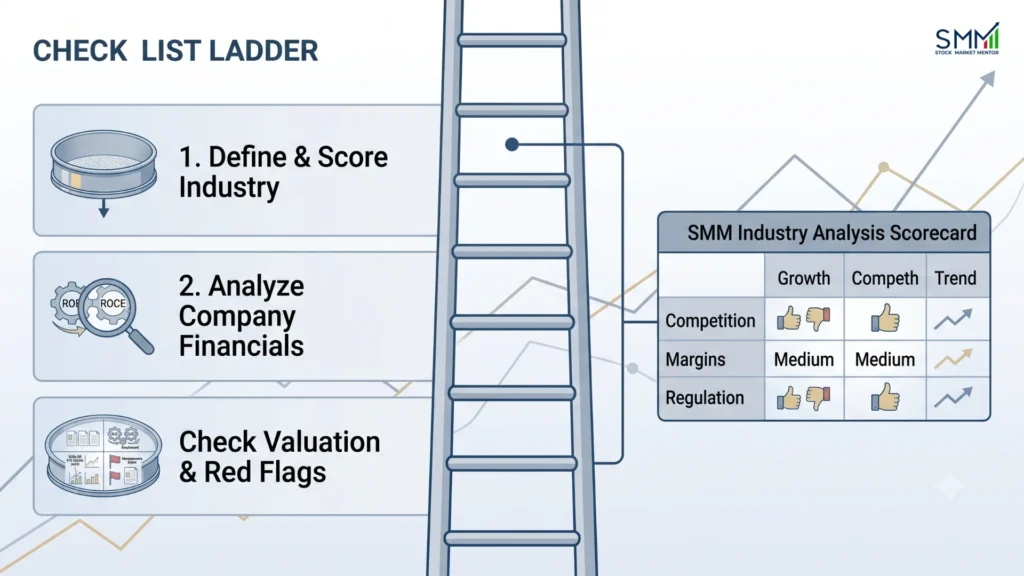
The SMM Industry Analysis Scorecard
A quick way to score any industry before you go company-hunting inside it:
Factor | What to measure | The question it answers |
Growth | CAGR, volume growth | Is demand actually expanding? |
Competition | Market share shifts, pricing | Can companies protect their margins? |
Profitability | Sector ROCE, margins | Is this industry economically attractive? |
Barriers to entry | Capital needs, regulation, licensing | Can new players enter easily? |
Customer power | Concentration, switching costs | Who holds the pricing power? |
Regulation | Recent/pending policy changes | Could rules alter the economics? |
Disruption risk | New technology, new business models | Could the structure change entirely? |
A Quick Checklist Before You Invest
- Defined the industry using an official classification, not a guess.
- Checked industry growth, life-cycle stage, and profitability.
- Run Porter’s Five Forces on the competitive landscape.
- Comparing company vs. industry-specific KPIs.
- Read the annual report, balance sheet, income statement, cash flow.
- Checked ROE, ROCE, ROIC against industry averages.
- Compared P/E, P/B, EV/EBITDA against history and peers.
- Screened for debt, cash flow, and governance red flags.
For investors who want to test whether a trading or investing approach would have worked historically, understanding what is backtesting strategy can also help distinguish a research process from hindsight.
Industry Analysis: Why It Matters Before You Invest ?
A company can look good on its own and still be a poor investment if the industry is slowing down, getting crowded or losing its edge. That’s why industry analysis needs to happen before you get too deep into the company’s numbers. Start with the industry, understand what is driving its growth, check the competition and risks, and then see where the company stands.
This is the same approach discussed at Stock Market Mentor, where understanding the sector comes before getting caught up in individual stock picks. Once you start looking at companies this way, the numbers have more context, and your research becomes much more meaningful.