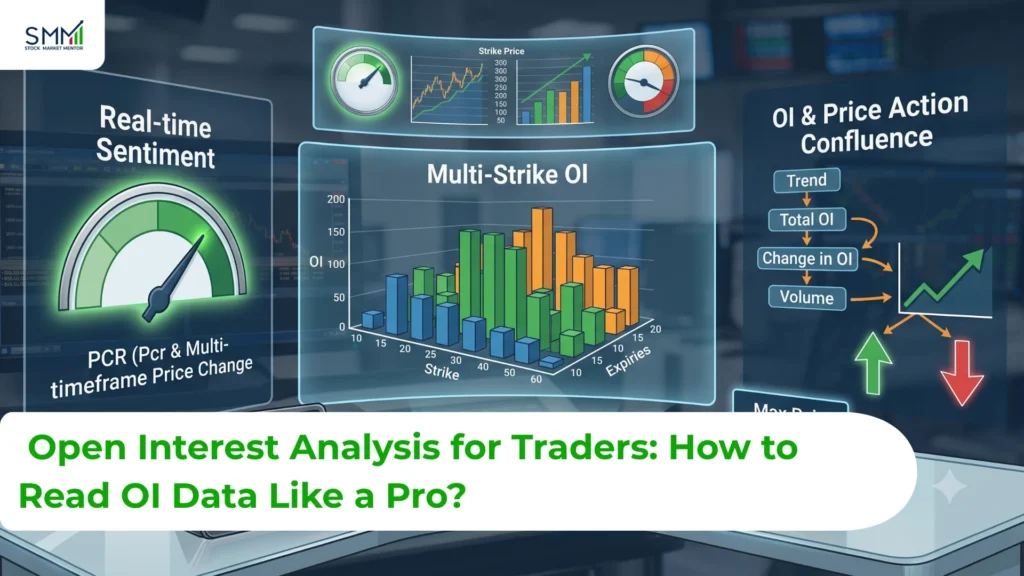
Have you ever opened an option chain and felt like too much was happening at once? NIFTY is moving up, Call OI is building at one strike, Put OI is changing at another, and you’re left wondering which figure deserves your attention.
If you look only at price, you see just part of the market story. This is where open interest analysis can help. OI shows how many derivative contracts are still open and helps you spot where traders are adding positions or closing them.
Still, OI is not a standalone signal. It cannot tell you by itself whether the market is likely to move higher or lower. You need to read it alongside price, volume, and price action.
In this blog, we’ll look at OI buildup and unwinding, the four key OI scenarios, option-chain OI, PCR, Max Pain, and FII/DII data. We’ll also bring these pieces together so you can use them more sensibly instead of relying on one number alone.
Quick answer: Open interest shows how many contracts are still open, not who’s bullish or bearish. Used with price and volume, it helps you spot where positioning is concentrated; used alone, it’s frequently misread.
What Is Open Interest in Trading?
If you are learning how to read open interest NSE data, this is the first distinction you need to understand. Open Interest (OI) is the number of outstanding derivative contracts in the market. That is, it shows the number of contracts that are still open after the buying and selling has happened.
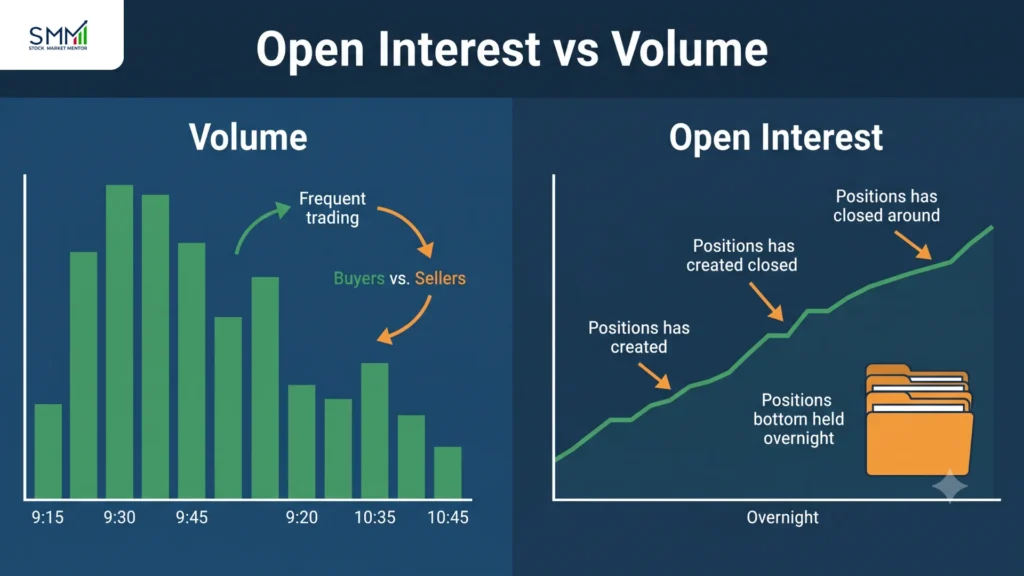
A lot of newbies get OI and volume confused, but they are not the same. OI goes up when new roles are taken and goes down when current positions are closed. A contract can also be bought and sold between traders without creating a new open position.
A simple way to remember the difference is:
- Price tells you where the market is moving.
- Volume tells you how much trading took place.
- Open Interest tells you how many contracts are still open.
Every open derivative contract has both a buyer and a seller. So, OI does not tell you who is winning. It only tells you how many contracts remain outstanding.
If you are learning how to read open interest NSE data, this is the first distinction you need to understand. NSE publishes daily Open Interest, Change in OI, and Participant-wise OI directly on its own reports page, and that’s the only place this data should be pulled from if you want it unfiltered.
Open Interest vs Volume
Suppose an option has a volume of 1,00,000 contracts but an OI of 40,000 contracts. That does not mean 1,00,000 new positions were created.
Volume counts the number of contracts traded during a particular period. OI counts the contracts that are still open at the end of that period.
This difference matters when you study OI data in options trading in India. A strike with high volume may simply be very active today. A strike with high OI, on the other hand, may have built up a large number of positions over several sessions.
How Does Open Interest Increase and Decrease?
OI rises when new positions are added to the market. It falls when existing positions are closed.
But don’t assume that rising OI is automatically bullish or that falling OI is automatically bearish. OI needs to be read alongside price. OI needs to be read alongside price, and traders can use broader technical indicators for trading to add context before interpreting a position.
Open Interest Buildup vs Unwinding: What Does It Signal?
What Is OI Buildup?
OI buildup means the number of outstanding contracts is increasing. It tells you that traders are adding positions, but it does not tell you the direction of those positions on its own. To understand that you look at the change in OI with the movement in price.
What Is OI Unwinding?
If OI is unwinding, it suggests the number of outstanding contracts is dropping. This is often because traders close existing positions. If a large number of positions are concentrated around an important price level, unwinding can sometimes lead to a sharp move.
That is why OI buildup vs unwinding can tell you more than simply looking at total OI.
The 4 Open Interest Scenarios Every Trader Should Know
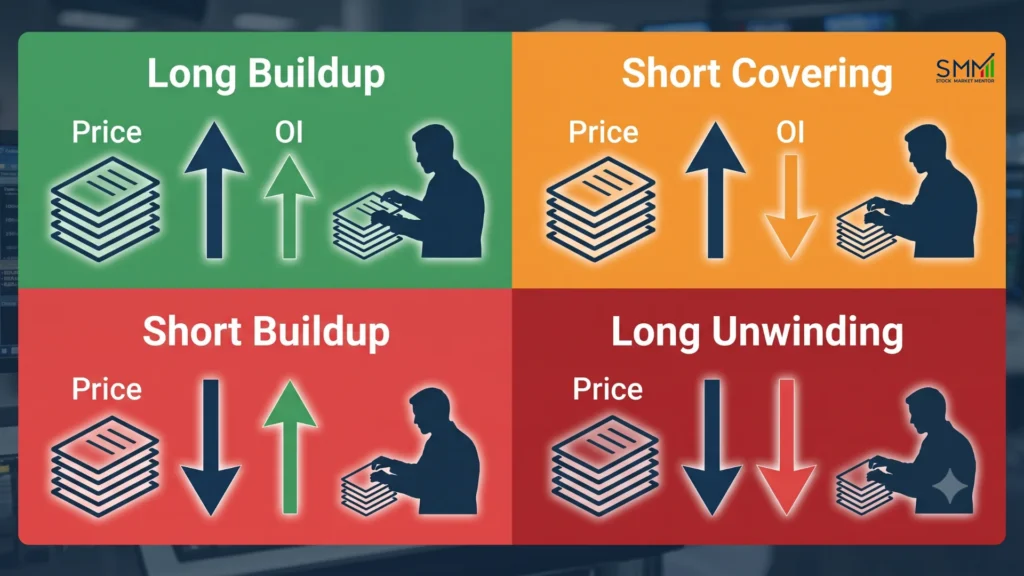
The four common OI scenarios are based on the relationship between price and OI. They are useful ways to interpret market activity, but they should not be treated as proof of exactly what every trader is doing.
Long Buildup
Price ↑ + OI ↑ = Long buildup
When price rises and OI also increases, traders generally refer to it as a long buildup.
The usual interpretation is that fresh positions are being added as the underlying moves higher. This can support a bullish view, especially when volume and price action confirm the move.
Short Buildup
Price ↓ + OI ↑ = Short buildup
Here the price is down and OI is up.
This is usually taken to mean additional short positions being added or bearish participation is increasing. A strong volume and a clear support breach make the signal stronger.
Long Unwinding
Price ↓ + OI ↓ = Long unwinding
In this case, both price and OI are falling. This may indicate that existing long positions are being closed. That is different from short buildup. During short buildup, OI rises as price falls. During long unwinding, OI falls along with the price.
Short Covering
Price ↑ + OI ↓ = Short covering
Here, price rises while OI falls. This may happen when traders holding short positions start closing them. Their buying can push prices higher, sometimes quite quickly. That is why a short-covering rally can look strong even when fresh long positions are not being added at the same rate.
Price | OI | Common Interpretation |
Rising | Rising | Long buildup |
Falling | Rising | Short buildup |
Falling | Falling | Long unwinding |
Rising | Falling | Short covering |
Don't rely on a single OI number to make a trading decision.
How to Use Open Interest With Price Action?
Why Should OI Never Be Read in Isolation?
One of the most common mistakes in OI analysis is spotting a large number and immediately trying to predict the market from it alone. Instead, ask three questions: Where is price? What is OI doing? How is price reacting to that OI?
Suppose NIFTY has heavy Put OI at a strike. That strike may act as a potential support zone. But if NIFTY breaks below it and Put OI starts unwinding, the support view weakens fast. The same logic applies on the Call side.
How we actually read it at SMM: mark the trend, note the biggest OI strikes, compare total OI against today’s change in OI, then watch how price behaves when it tests that strike, only then check volume and expiry, and only then consider a trade with a stop already set. It fails in a predictable way, too: high Put OI doesn’t guarantee support, since price can break straight through it as those puts unwind, heavy Call OI can fail the same way on the upside, especially near expiry as traders roll or close out. And OI alone never reveals direction, every contract has a buyer and a seller, so it’s a positioning map, not a forecast.
Price + OI + Volume
Suppose price is rising, OI is rising and volume is also strong. That gives you better confirmation than rising OI alone.
Now consider a situation where price is rising, but OI is falling. In that case, short covering may be helping drive the move.
If price is falling, OI is rising and volume is strong, bearish positioning may be building.
When price and OI do not agree, don’t force an interpretation. It is usually better to wait for clearer confirmation. When price and OI do not agree, don’t force an interpretation; it is usually better to wait for clearer confirmation or use backtesting a trading strategy to evaluate whether a setup has historically worked.
How to Read Open Interest in an Options Chain?
What Call OI Tells Traders?
Traders usually watch Call OI at strikes above the current market price.
A strike with heavy Call OI may become a potential resistance area because a large number of positions are concentrated there. But it is not a guaranteed ceiling.
If Call OI continues to increase while price struggles below that strike, the level becomes more important to watch. If Call OI starts falling while price moves higher, the resistance may be weakening.
What Put OI Tells Traders?
Put OI is generally watched at strikes below the current market price.
Heavy Put OI can point to a potential support area. Fresh additions to Put OI may make that level more relevant, while Put OI unwinding may suggest that the support structure is losing strength.
Identifying OI Concentration Across Strikes
Don’t focus only on the strike with the highest OI.
Look at the surrounding strikes as well.
A large OI can lead to several Call strikes forming a more widespread resistance level. If there is OI in Put strikes, it can lead to a support level being formed.
This gives you a more realistic view of the option chain than treating one strike as an exact turning point.
Change in OI vs Total OI
Total OI shows you the existing structure of positions.
Change in OI shows you how that structure has changed during the selected period. You need both.
A strike may have very high total OI but little fresh activity today. Another strike may have lower total OI but a sharp increase in OI during the session. The second strike may be more useful when you are trying to understand current positioning.
Put-Call Ratio and Open Interest Analysis
What Is Put-Call Ratio?
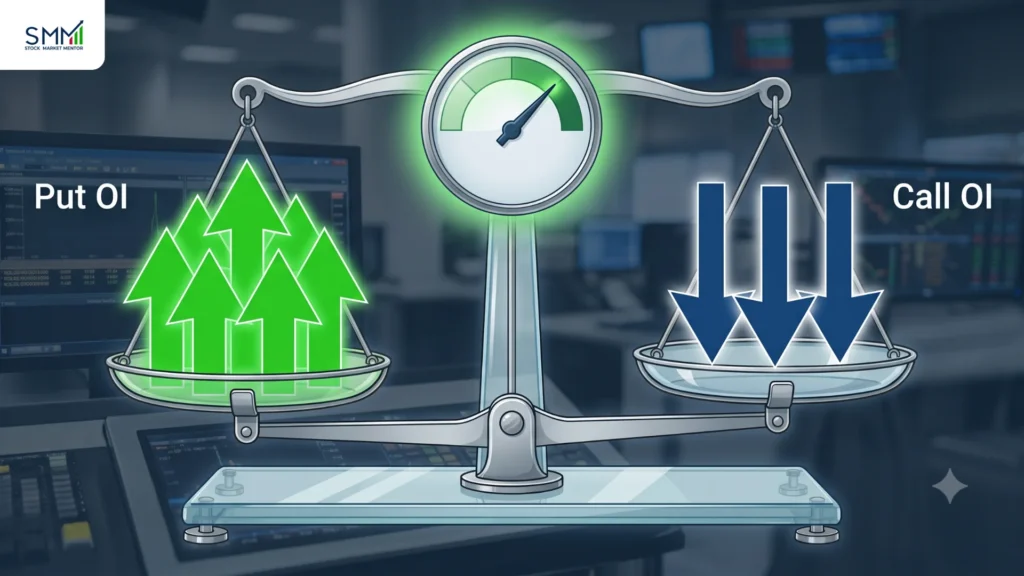
The Put-Call Ratio (PCR) compares Put OI with Call OI.
PCR = Put Open Interest ÷ Call Open Interest
For example, if Put OI is 12 lakh contracts and Call OI is 10 lakh contracts, the PCR is 1.2.
What Does PCR Above 1 Mean?
A PCR above 1 means Put OI exceeds Call OI, which traders often read as a mild bullish tilt; below 1 is often read as a mild bearish tilt, since Call OI dominates.
Be careful with that reading, though; PCR measures positioning concentration, not confirmed sentiment. A trader buying puts and a trader selling puts both add to Put OI, and they hold opposite views. PCR can also be pulled around by hedging activity and the overall market mood, always pairing it with price action, change in OI, volume, and key strikes rather than reading it on its own.
Max Pain Theory: What Traders Need to Know?
What Is Max Pain?
The Max Pain theory establishes the strike price at which the option buyers, as a group, will suffer the most losses as the options expire in their current distribution.
How Do Traders Use Max Pain?
Some traders use Max Pain as a theoretical reference or possible expiry “magnet.” They compare it with the current market price, major OI concentrations, and other information from the option chain.
However, the Max Pain level can change as traders add or close positions.
Limitations of Max Pain
Max Pain does not control the market. News, volatility, institutional activity and sudden changes in positioning can push price far away from the theoretical level. It is better used as one reference point rather than as a prediction of where the market must expire.
FII vs DII Open Interest Data: What Traders Should Watch
FII stands for Foreign Institutional Investors; DII stands for Domestic Institutional Investors. Their positioning offers useful context, particularly when you track futures positions across several sessions rather than a single day.
NSE publishes daily Participant-wise Open Interest and FII Derivatives Statistics directly on its official derivatives reports page, broken down across four categories: Client (retail and HNI), Pro (proprietary desks), FII, and DII. Since DIIs are largely restricted to hedging in derivatives, their footprint here tends to be small compared with FII and Pro activity, which is why most traders focus on FII and Client OI when reading this report.
What the Latest SEBI Data (FY26) Means for OI Readers?
On August 20, 2026, SEBI released two studies on individual trader activity in the equity derivatives segment covering FY26. A few numbers from that release change how you should think about acting on OI signals:
- 87.7% of individual traders lost money in FY26: an improvement from 91% in FY25, but still nearly 9 in 10 traders.
- Options trading accounted for roughly 92% of aggregate individual trader losses, far more than futures.
- Retail participation itself contracted sharply: active individual derivatives traders fell about 18% year-on-year to roughly 87.5 lakh, the segment’s first annual decline in a decade.
- The average loss per losing trader was around ₹1.47 lakh, about 21% higher than the average gain among profitable traders, meaning losses, when they happen, tend to be bigger than wins.
- SEBI’s data also shows retail activity remains heavily concentrated in very short-duration index options, with a large share of turnover happening on or within a day of expiry, same-day, expiry-day trading, sometimes labelled “0DTE” in global options markets.
- A companion SEBI study on trading behaviour found that around 97% of individual traders were predominantly option buyers, versus roughly 2% who were predominantly sellers, and buyers recorded meaningfully weaker outcomes than sellers.
Why is this important for OI? OI-based setups like reading a Call wall as resistance, a Put wall as support, and chasing a PCR extreme are often used to justify short-dated, expiry-day options trades, which produce the most retail losses. OI reveals positional concentrations. It cannot tell you if the trade is sized appropriately, if you have a stop, or if you’re trading a level because your research supports it or because the chart number looks dramatic.
SEBI's Position-Limit Safeguards You Should Know
Under SEBI’s Framework for Intraday Position Limits Monitoring for Equity Index Derivatives (September 2025), exchanges track position limits across the trading day using multiple random intraday snapshots, rather than only checking positions at day’s end. This followed SEBI’s broader October 2024 measures to strengthen the equity index derivatives framework, which included upfront collection of option premiums and tighter handling of calendar spreads on expiry day.
Practically, this means the OI figure you see on the option chain during market hours reflects a market where position build-up is being watched more closely than it used to be, which is one more reason extreme, sudden OI spikes deserve a second look rather than an immediate trade.
Open Interest Analysis Example: Read an Option Chain Like a Pro
Suppose NIFTY is trading near 24,500 and you are looking at the nearest expiry.
You notice:
Strike | Call OI | Call OI Change | Put OI | Put OI Change |
24,300 | Moderate | Small | High | Rising |
24,400 | High | Rising | Very High | Rising |
24,500 | High | Moderate | High | Moderate |
24,600 | Very High | Rising | Moderate | Small |
24,700 | Very High | Rising | Low | Small |
First, 24,500 is your approximate ATM reference.
On the downside, 24,400 has strong Put OI and fresh additions. That makes it a level worth watching as potential support.
On the upside, 24,600 and 24,700 have heavy Call OI, and that OI is increasing. Together, they create a potential resistance zone.
Now bring price action into the picture.
If NIFTY holds above 24,400 and moves towards 24,600, watch what happens to Call OI. If price breaks above 24,600 while Call OI starts unwinding, the resistance may be weakening.
Expert Insight: Reading OI in isolation is one of the most common gaps we see in traders who come to us self-taught. In our FNO Champion course, Option Chain and Open Interest interpretation is taught alongside Options Greeks, implied volatility, and Put-Call Ratio, not as a separate topic, because in practice, no single one of these tells the full story on its own. A trader who can read OI buildup but doesn’t understand how time decay or IV is behaving at that strike is still trading half-blind. Our approach with students is simple: use OI to identify where positioning is concentrated, then confirm with price action and volume before sizing a trade, never the other way around.
Common Open Interest Analysis Mistakes
- Confusing OI with volume.
- Assuming rising OI is always bullish.
- Treating falling OI as automatically bearish.
- Assuming high Call OI guarantees resistance.
- Assuming high Put OI guarantees support.
- Ignoring price action.
- Looking at only one strike.
- Using PCR as an absolute signal.
- Ignoring expiry and rollover.
- Blindly following FII/DII positioning.
- Assuming Max Pain predicts the expiry price.
- Assuming OI reveals exactly where “smart money” is positioned.
- Trading an OI setup without defining risk.
Confusing OI with volume is particularly common among new traders, which is why understanding the fundamentals covered in stock market for beginners can provide a stronger foundation.
Open Interest Analysis Guide for Better Trading Decisions
Open interest is useful, but it should not be read on its own. Price, volume, PCR, and price action all help explain what may be happening in the market. Looking at these together can give traders a clearer view than relying on a single number or signal.
If you want to learn how to use this information in real trading situations, Stock Market Mentor covers topics such as F&O, option chains, open interest, strategy building, and risk management. It is about making sense of the market and not following tips or calls.
Disclaimer: This article is for educational purposes only and does not constitute investment advice, a recommendation, or an offer to trade in securities or derivatives.