
You’ve probably seen this happen: a stock you’ve been watching suddenly climbs 8% in just three days. By the time you notice, the move is already underway. So what do you do, buy now, or accept that you may have missed it?
This is where many traders get stuck. Some jump in because they’re afraid the price will keep rising. Others wait for the “perfect” entry and end up watching the opportunity pass.
Most of the time, the real issue isn’t finding stocks to trade. It’s knowing how to identify a good setup, confirm it, and decide how much risk to take.
That’s where swing trading strategies help. Rather than trying to profit from every small intraday move, swing traders look for price moves that may develop over a few days or weeks. They study the trend, price action, volume, support and resistance, and decide where to exit if the trade goes against them before they enter.
In this blog, we’ll learn the timeframes swing traders use, how to screen for potential stocks, and a few practical setups. We’ll also talk about volume confirmation, sector strength, risk management and walk through a genuine NSE example.

What Is Swing Trading and How Does It Differ From Intraday Trading?
Swing trading means holding a stock for a few trading sessions or sometimes a few weeks, with the aim of catching a meaningful part of a price move. You are not trying to profit from every small movement during the day. Instead, you wait for a setup that makes sense and give the trade some time to work.
Most swing traders focus on price structure, trend, volume, support, and resistance. For example, they may look for a stock breaking out of a range, pulling back to support, or continuing an existing trend.
Intraday trading is different. You open and close the position on the same day, so you have to deal with more short-term noise and usually spend more time watching the market.
For someone with a full-time job, this is where swing trading vs intraday becomes an important choice. With swing trading, you do not have to watch every five-minute candle. You can study charts after market hours, mark your levels, and decide beforehand where you will enter, exit, or cut the trade.
Factor | Intraday Trading | Swing Trading |
Holding period | Same day | Days to weeks |
Screen time | Usually high | Moderate |
Main charts | Intraday | Daily and weekly |
Overnight risk | Lower | Higher |
Trading frequency | Higher | Lower |
Main focus | Short-term movement | Larger price swings |
Best Timeframes for Swing Trading in India
The timeframe you use can change the way you see a trade. If you are trying to catch a move that may last two or three weeks, a five-minute chart can easily create confusion.
Why Do Daily Charts Matter?
The daily chart is usually the main chart for swing trading. It helps you identify:
- Support and resistance
- Breakouts
- Pullbacks
- Higher highs and higher lows
- Consolidation patterns
- Changes in momentum
Suppose a stock has been moving between ₹900 and ₹1,000 for three weeks. On the daily chart, the ₹1,000 resistance level is easy to see. A close above ₹1,000 then carries more weight than a brief move above that level on an intraday chart.
How Weekly Charts Show The Bigger Trend?
The weekly chart gives you a broader context.
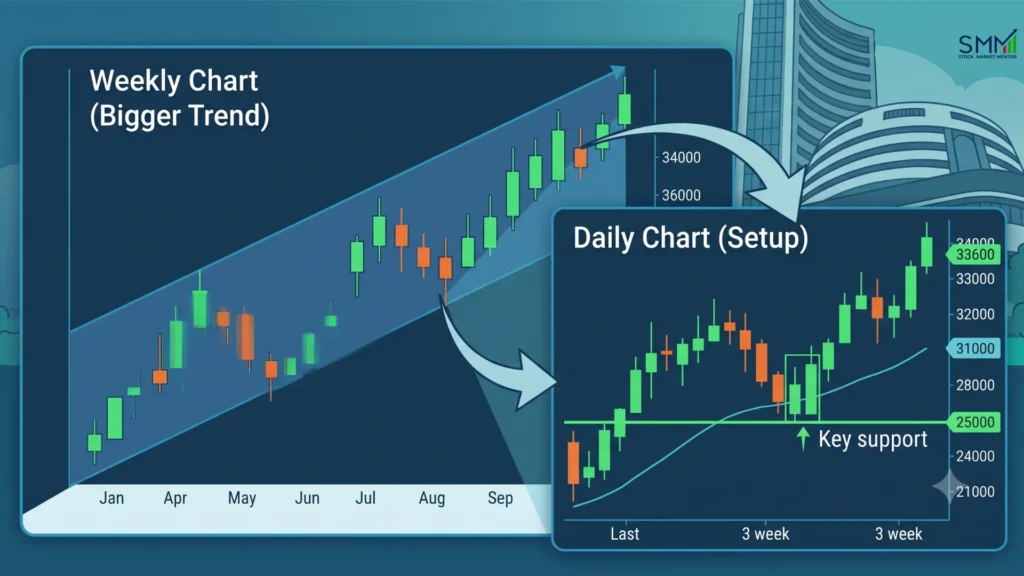
Before buying a daily breakout, check whether the weekly chart shows a strong uptrend, a long-term range or major resistance close to the current price.
A simple rule is:
Weekly chart → identify the bigger trend → Daily chart → find the setup → manage the trade
Ready to Build a More Structured Trading Process?
How to Screen Stocks for Swing Trading?
Finding good swing trading stocks in India in 2026 becomes easier when you reduce the number of charts you need to study. You do not need to manually scan every stock listed on the NSE.
Start off by picking stocks that trade consistently and also have enough liquidity. After this, identify those stocks that have a defined trend, acceptable volatility, and a well-defined price pattern.
A stock that would be good for swing trading could have:
- A good daily trading volume.
- Sufficiently tight spreads.
- Defined trends or consolidations.
- Strong relative performance.
- Defined support and resistance.
- Enough room for a potential move.
Using Screener.in
Screener.in can help you narrow down the stock universe using financial and market-based conditions. You can create a shortlist using factors such as market capitalisation and price performance, and then move those stocks to your charts. It also offers technical screens based on moving averages, RSI, and volume. (screener.in)
Using Chartink
Chartink is useful when you want to build more technical scans. You can combine conditions involving price, moving averages, volume, and momentum to find stocks that match a particular setup.
A practical workflow looks like this:
Large stock universe → Screener → Chartink → Chart review → Qualified setups → Watchlist
If you’re still building your technical-analysis foundation, our guide to technical indicators for trading explains how RSI, MACD, Bollinger Bands, VWAP and moving averages can be used without overcrowding your charts

What SEBI's Own 2026 Data Says About Retail Trading Outcomes?
Here’s something worth sitting with before you place your next trade. On August 20, 2026, SEBI released two studies on individual trader profitability in the equity derivatives segment for FY25–FY26. The headline number: 87.7% of individual traders lost money in FY26, an improvement from roughly 91% a year earlier, but still nearly nine out of ten participants ended the year in the red. Aggregate net losses came in at approximately ₹91,685 crore, and the average loss per trader actually rose to about ₹1.17 lakh, even as the number of active traders fell sharply. Worth repeating: that 87.7% figure is about derivatives traders, not people holding stock for a few days as you’d do in swing trading.
Swing trading in the cash/delivery category involves buying shares outright, holding them for days or weeks, and not using leverage to defend a position against time decay or a margin call. Individual traders in leveraged options and futures account for 92% of losses, and most movement is in contracts expiring within a week, according to SEBI. The risk profile is different from owning a stock through a multi-day trend.
This doesn’t mean swing trading in equities is safe; poor risk management may cost you anytime. It’s a reason to be exact about what you’re doing and realize that discipline, not luck, determines results.
Top Swing Trading Strategies for Indian Stocks
There are many technical setups, but you do not need to trade all of them. These three cover several common situations that swing traders come across.
Breakout and Retest Strategy
A breakout happens when price moves above a resistance level that has repeatedly stopped buyers.
Suppose a stock has been trading between ₹900 and ₹1,000 for several weeks. Each time it approaches ₹1,000, sellers push it back down.
Then one day, the stock closes above ₹1,000 with strong volume.
That is the initial breakout signal.
Some traders do not buy immediately. They wait to see whether the stock comes back toward ₹1,000, holds that old resistance as support and starts moving higher again. This is called a retest.
Pullback Trading Strategy
A pullback setup begins with an established trend.
Imagine a stock moves from ₹700 to ₹800 while making higher highs and higher lows. Instead of continuing straight up, it falls back toward ₹760.
If ₹760 turns out to be an important support level and the selling pressure begins to ease, then it might be a more attractive entry point than buying after the initial rally.
A trader may wait for a reversal candle or another sign that buyers are returning before entering.
Trend Continuation Strategy
Trend continuation is related to pullback trading, but the price action is slightly different.
In this case, the stock already has strong momentum and then pauses in a tight range. It does not necessarily fall back deeply. Instead, it builds another base before trying to move higher.
That pause can create a second entry opportunity. Look for:
- Higher highs and higher lows
- Strong existing momentum
- Short consolidation
- Support holding
- Volume expansion during the continuation move
Which strategy should you use?
It depends on what the market is showing you.
Strong breakout + strong volume → Breakout and retest
Established trend + controlled retracement → Pullback
Strong trend + tight consolidation → Trend continuation
There is no single best swing trading strategy NSE traders can use in every market condition.
Volume Confirmation: The Filter Most Swing Traders Miss
Price tells you what happened. Volume gives you an idea of how much participation was behind the move.
This is especially useful when a stock is breaking out.
A stock moving above resistance with unusually strong participation is generally more convincing than one that drifts above the same level on weak volume.
Still, volume should not be treated as a magic number.
A sudden volume spike can happen because of panic selling, block deals, news, or other unusual activity. You need to look at the price action alongside the volume.
Before entering, ask yourself:
Is volume supporting the price move, or is price moving without meaningful participation?
That simple question can help remove many weak setups from your watchlist. Want to understand how traders can read the chart without relying heavily on indicators? Learn more about price action trading, including market structure, breakouts, retests and trade invalidation.
How to Manage a Swing Trade?
Before entering a trade, decide where your idea becomes invalid.
If you buy a stock because it has broken above ₹1,000, and it later falls back below the structure that supported the breakout, that may be the point where the trade thesis is no longer valid.
Your stop should be based on that structure rather than on an arbitrary percentage.
Position size should come after you decide the stop.
Position size = Maximum acceptable loss ÷ Risk per share
For example, if you are willing to risk ₹2,000 and the difference between your entry and stop-loss is ₹40 per share: ₹2,000 ÷ ₹40 = 50 shares
This keeps your risk consistent even when different stocks have different prices and volatility.
Partial profit booking can also be useful. You may book part of the position near the first target and keep the remaining shares open if the trend continues.
The important thing is to decide this before entering, not after the stock starts moving.
Trailing stops should also follow the price structure. For example, you might trail the stop below new swing lows instead of moving it after every small candle.
Exit when the target is reached, the setup is invalidated or the trend clearly changes. If you want to develop these skills systematically, explore the Pro Trader Course, which covers technical analysis, price action, volume analysis, trading strategies and risk management.
The Tax Side Nobody Mentions: How Swing Trading Gains Are Actually Taxed
Because swing trades are typically held for days to a few weeks, always well under 12 months, the gains almost always fall under Short-Term Capital Gains (STCG), not long-term. Under Section 111A of the Income Tax Act, STCG on listed equity shares sold through a recognised stock exchange, where Securities Transaction Tax (STT) has been paid, is taxed at a flat 20% (raised from 15% for transfers on or after July 23, 2024), plus applicable surcharge and cess. This flat rate applies to the entire gain; it isn’t adjusted against your basic exemption limit the way salary income is, except for resident individuals and HUFs in specific cases.
One catch: this assumes your trading counts as capital gains, not business income. If you trade often enough or treat it like a full-time activity, the tax department can classify it differently, and Section 111A won’t automatically apply. When in doubt, check with a CA before you file.
Shares held for more than 12 months are eligible for long-term capital gains tax at 12.5%, with an exemption of ₹1.25 lakh per year, under Section 112A. If swing trading succeeds, budget for the 20% tax on profitable exits, not the reduced long-term rate. This is a common mistake by traders when filing returns. A good accountant can help you figure out your tax liability depending on your whole income picture.
The 5-Point Swing Setup Score
Before entering, score the setup out of 10. It’s not a magic formula, just a quick way to avoid talking yourself into a weak trade.
Check | Points |
Trend alignment (daily + weekly agree) | 0–2 |
Clean price structure (clear support/resistance). | 0–2 |
Volume confirming the move | 0–2 |
Sector strength | 0–2 |
Risk-to-reward at least 1:2 | 0–2 |
8–10: worth taking. 6–7: watchlist, wait for confirmation. 5 or below: skip it.
This is our own screening habit, not a backtested guarantee. You can treat it as a discipline tool.
Real Swing Trading Example on an NSE Stock
A useful recent example is Cyient Ltd. The following is a retrospective technical example based on NSE price and volume data available in August 2026. It is not a recommendation to trade the stock. Data source: NSE historical price and volume data, accessed in August 2026.
On August 13, Cyient broke above the ₹875 area that had capped it for days, and did it on about 3.5 times the previous day’s volume. Here’s how the trade actually played out:
Date | Close | What it showed |
Aug 12 | ₹840.50 | Base, below resistance |
Aug 13 | ₹879.65 | Breakout, volume confirms |
Aug 14 | ₹867.05 | Pullback begins |
Aug 18 | ₹858.55 | Setup under stress |
Aug 19 | ₹894.50 | Strong rebound |
Aug 24 | ₹909.05 | Trend continues |
What you’d have known on August 13: a breakout, backed by real volume, above a level that had held for weeks. That’s it.
What you wouldn’t have known: whether ₹858.55 on August 18 was a normal pullback or the start of a failed breakout, you only find that out afterward.
What would have invalidated it: a close back below ₹858.55, the old resistance-turned-support. That’s the line a trader would’ve watched, not the eventual high of ₹934.85.
The stock then jumped sharply on August 25 after its investor-day presentation, showing why event risk matters when holding a swing position overnight. The repeatable principle matters more than the stock itself:
Breakout area + improving volume + sector support + defined risk = a setup worth studying.
Expert Insight: At Stock Market Mentor, the pattern we see most often in our Pro Trader course, which covers technical analysis and live trading sessions from basics through advanced strategy, isn’t a secret indicator or a “better” chart pattern. It’s traders who write down their invalidation level before they enter, and traders who don’t. The ones who plan their exit before their entry are the ones still trading a year later.

What We've Noticed Across Hundreds of Trades?
In our review of 300+ swing trades, our own and our students’, one pattern shows up again and again. It’s not about finding a secret indicator. It’s about what happens before the trade.
Traders who write down their invalidation level before entering tend to stick around a year later. Traders who don’t usually don’t. It sounds too simple to matter, but it’s the single biggest difference we see between someone who survives a bad month and someone who blows up their account in one.
The same goes for position sizing. The traders who size their position off the stop-loss, not off how “confident” they feel, are the ones whose account curve stays boring, in a good way.
None of this is exciting advice. But swing trading rewards boring discipline far more than it rewards clever entries.
Common Swing Trading Mistakes to Avoid
Knowing what to avoid can help you protect your capital and stay consistent when the market does not move as expected.
- Chasing a breakout.
- Ignoring volume.
- Trading against the higher-timeframe trend.
- Using too many indicators.
- Oversizing the position.
- Moving the stop because of emotions.
- Treating every 5-15% move as achievable.
Still deciding which trading style fits your schedule? Compare intraday, swing and long-term trading before choosing your approach.
Build Up Your Swing Trading Strategies With Stock Market Mentor
Swing trading is not about trying to capture every large price move. It is about finding trades that make sense, knowing where to enter, deciding how much you are willing to lose, and giving the trade enough room to work.
A few reliable swing trading strategies can help you approach the market with more structure. If you want to improve these skills, Stock Market Mentor offers practical guidance on swing trading, price action, volume analysis, and risk management.
Disclaimer: This article is for educational purposes only and does not constitute investment advice, a trading recommendation, or a solicitation to buy or sell any security.