If you’ve ever looked at a normal volume bar at the bottom of your chart and thought, “okay, but where exactly did all this trading happen?”, that’s the gap Volume Profile fills. A good volume profile trading course will educate you not just on where volume occurred; it will teach you how to read POC, value area, HVNs, and LVNs within the framework of actual market structure.
This guide covers what a proper Volume Profile and Market Profile course should actually teach, the core concepts, how to apply them on NIFTY and Bank NIFTY, common mistakes, and what to look for before choosing a volume profile certification/course.
Key takeaways:
- Volume Profile shows how trading activity is distributed across price levels rather than simply across time.
- The busiest pricing of the session and “fair value” range are POC, VAH and VAL.
- HVN and LVN zones are where traders put real entry, stops and exits.
- A substantial proportion of the Indian index options volume takes place close to expiry and it can influence what a POC is actually conveying to you.
- Structured, live-market training is the bridge between understanding the definitions and reading an actual chart.
Expert insight: Volume Profile has a two-speed learning curve that course marketing rarely spells out. The concepts themselves, like POC, VAH/VAL, HVN/LVN, are usually understood within a few weeks. What takes longer is “profile intuition”: recognising within seconds whether a session is shaping up balanced or trending, without consciously counting bars. That only comes from repeated exposure to live charts across different conditions, trending months, range-bound months, high-volatility expiry weeks, not from a fixed number of classroom hours. A realistic expectation is solid conceptual command in 1–2 months, with genuine pattern-recognition speed developing only after 3–6 months of consistent chart time beyond the course itself.
What exactly is the Volume Profile?
A normal volume bar sits below your candles and tells you one thing: how much was traded on that day or candle. It says nothing about where.
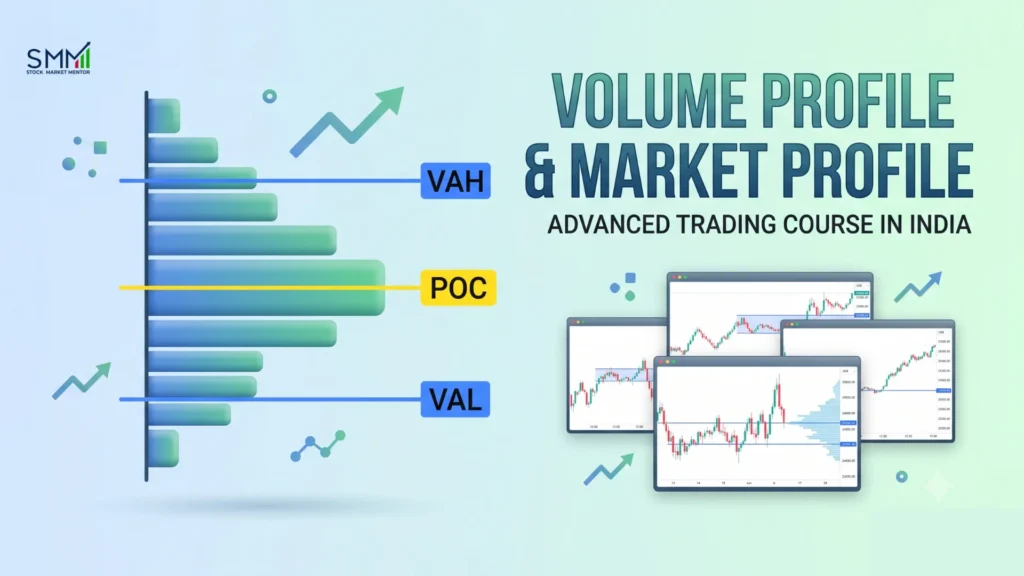
Volume Profile flips this around. It plots volume sideways, next to the price axis, so each price level gets its own bar showing how much was traded there. Instead of one number for the whole session, you get a picture of where the market spent most of its time and money.
Volume Profile vs Plain Volume Bars
Point | Plain Volume Bars | Volume Profile |
Shows | Volume over time | Volume at each price level |
Direction | Vertical, below chart | Horizontal, beside price |
Tells you | How active the session was | Where the activity happened |
Useful for | General interest, trend confirmation | Finding support, resistance, fair value |
Best paired with | Moving averages, trend tools | Price action, VWAP, order flow |
Plain volume bars aren’t useless; they still show building interest. But they can’t tell you where the fight between buyers and sellers actually took place. That’s the job of Volume Profile. Traders can also combine Volume Profile with other technical indicators for trading to add context rather than relying on one tool in isolation.
POC, VAH, VAL – Explained With a Chart Example
Most traders get overwhelmed trying to learn ten Volume Profile terms on day one. You really only need three to get started.
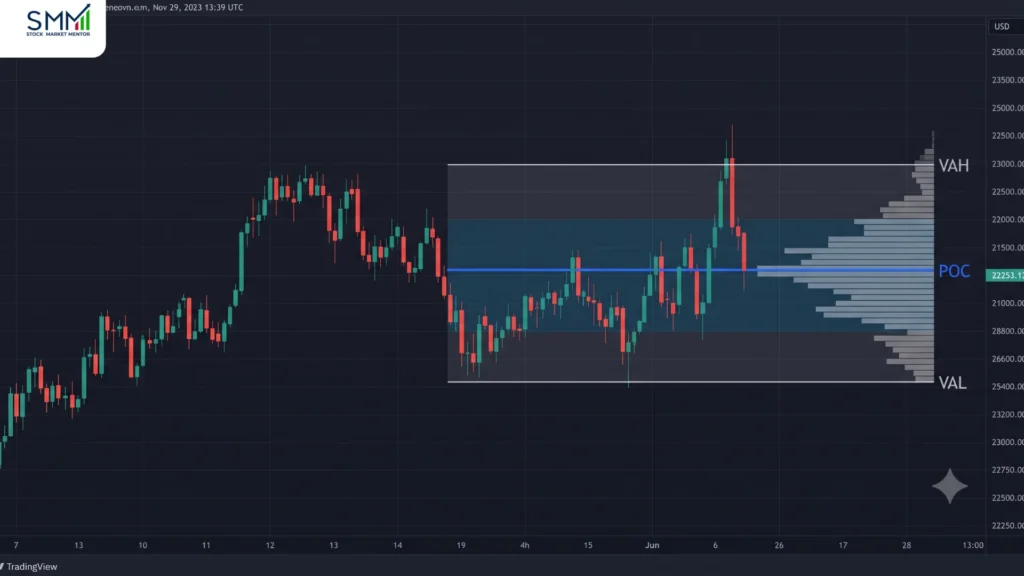
Point of Control (POC) is the price where the most volume traded, which is the busiest price of the session. Picture a Volume Profile chart for Bank NIFTY where the widest bar sits at, say, 51,200. That’s your POC. Traders treat it as a reference level to watch, since price can revisit areas where substantial prior activity occurred, though that’s a tendency, not a guarantee.
Value Area High (VAH) and Value Area Low (VAL) mark the top and bottom of the zone where roughly 70% of the day’s volume traded. If Bank NIFTY’s value area runs from 51,050 (VAL) to 51,350 (VAH), that band is the “fair” range for the session. A move outside it, say a spike to 51,450, happened where fewer participants were willing to trade, which is why it can move fast.
A simple way to visualize it: a balanced day looks like a bell curve, fat in the middle around the POC, thin at both ends near VAH and VAL. A trending day looks stretched and lopsided, with most volume bunched near one edge instead of the centre. Price entering the thin ends and rejecting back into the fat middle is one of the more common setups traders watch for.
Volume Nodes: How They Signal Entries and Exits?
Beyond POC and Value Area, Volume Profile splits the session into High Volume Nodes (HVN) and Low Volume Nodes (LVN), and this is where entries and exits actually get created.
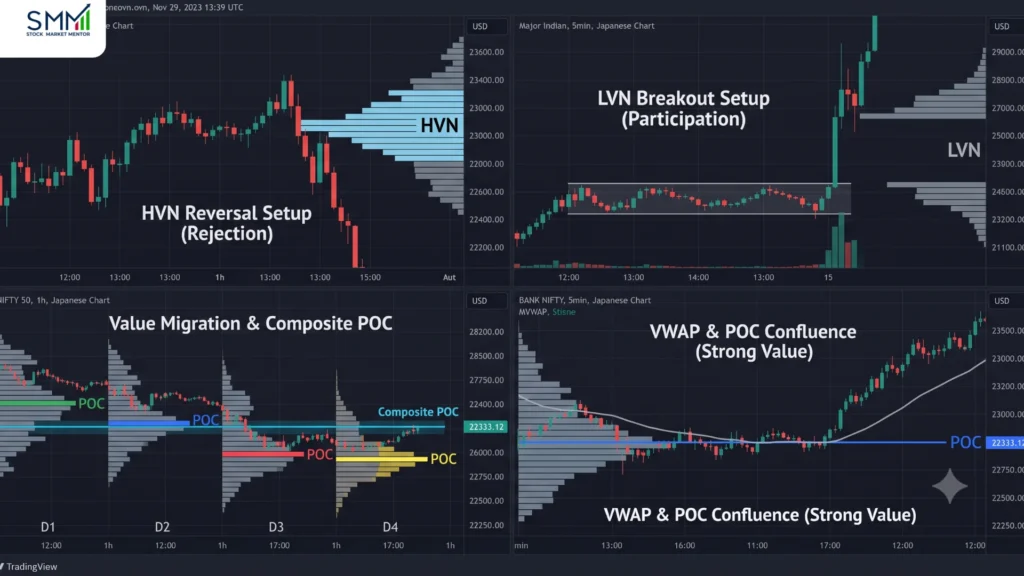
- High Volume Node (HVN): A thick, congested band where a lot of trading happened. Price often slows down, consolidates, or reverses here. Treat HVNs like support/resistance shelves.
- Low Volume Node (LVN): A thin, hollow gap where very little trading happened. Price can move through an LVN quickly, particularly when it does so with strong participation, though this shouldn’t be treated as a guaranteed continuation signal.
How traders actually use this in practice:
- Entry near an HVN: Wait for a reaction, a rejection candle, slowing momentum, before entering, rather than trading blindly.
- Exit before the next HVN: Booking partial profit as price approaches the next high-volume shelf is a common, reasonable approach, since that’s often where momentum slows.
- Breakout through an LVN: Strength through a low-volume zone is a signal worth riding rather than fading, with confirmation from volume or order flow.
- Stop-loss placement: Placing stops just beyond an HVN, not right at it, avoids getting shaken out by normal noise inside a busy zone.
The levels only become useful once you attach an entry, stop, and target to each one, that’s the practical difference between memorising definitions and trading with them. Understanding broader trading strategy in India can also help put these setups into a wider trading framework.
Market Profile and TPO: The Other Half of the Picture
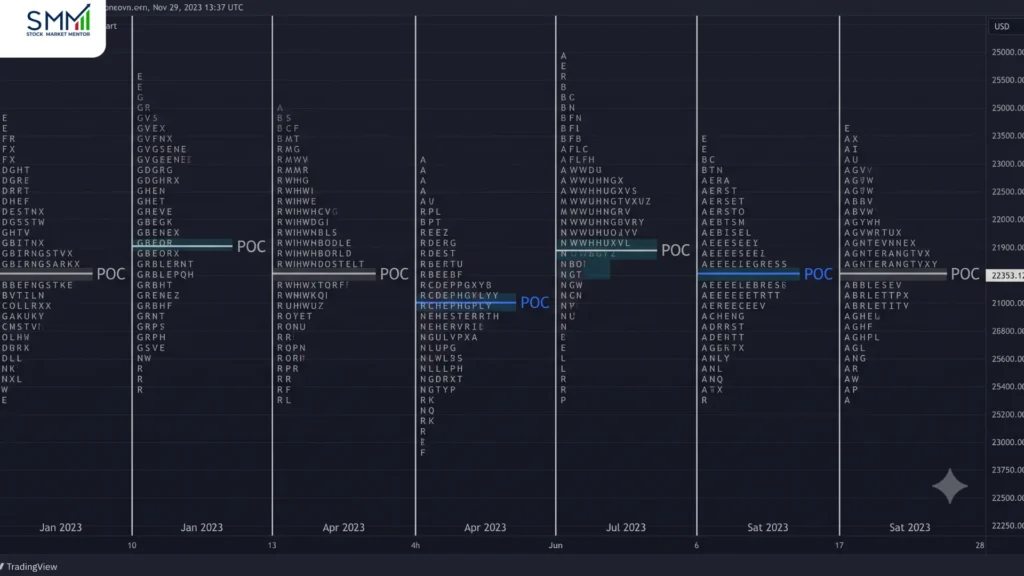
Market Profile is Volume Profile’s older cousin. It emerged from the work of J. Peter Steidlmayer at the Chicago Board of Trade in the early 1980s, and today CME Group documents much of the modern TPO methodology built on his original work. Instead of measuring volume at each price, it measures time: how many 30-minute periods, called TPOs (Time Price Opportunities), price spent at each level.
The two tools often produce a similar bell shape, but answer slightly different questions. Volume Profile shows where participation was heaviest. Market Profile shows where the market spent its time. Used together, they give a fuller read on whether a level is genuinely important or just briefly visited.
Market Profile also brings in concepts like Initial Balance (the first hour’s trading range) and auction theory, the idea that markets constantly “auction” price up or down until buyers and sellers agree on value. This framework is what serious intraday and index traders build their day around.
Ready to learn Volume Profile with practical NIFTY and Bank NIFTY examples?
The POC Reality Check: How Serious Traders Read POC Differently?
Textbook explanations treat POC like a fixed rule: price gets pulled back to it, so treat it as a level. What’s rarely mentioned is where the volume behind that POC actually came from, and on Indian index options, that detail changes how much weight a POC deserves.
SEBI’s own August 2026 study on individual derivatives traders found that Indian index-options trading stays heavily concentrated around expiry: 59% of index-options turnover happened on the expiry day itself (same-day, or 0DTE, contracts), and roughly 75% within one day of expiry (SEBI, “Trading Behaviour of Individual Traders in the Equity Derivatives Segment,” Aug 20, 2026). That matters for Volume Profile, because a profile built purely from options turnover can look “busy” simply because expiry-day positioning spiked, not because genuine value was established at that price.
A quick three-step check before trusting a POC:
- Origin: Was this session an expiry-heavy day? If so, treat the POC with more caution.
- Reaction: Is price accepting or rejecting the level over the next few candles, not just touching it once?
- Confluence: Does VWAP agree with the POC? Agreement between the two carries more weight than either alone.
Illustrative walkthrough (not an actual trade record): Say Bank NIFTY’s options-turnover profile on an expiry day shows a POC at 51,600, but the underlying futures/index profile for the same session shows heaviest participation lower, around 51,300. That gap is the indication; the “busy” 51,600 print was largely expiry-day options churn, not the level where the underlying itself found agreement.
A trader following the Reality Check would weight the futures-based POC (51,300) more heavily and treat 51,600 as noise until price actually re-tests and holds it on a normal-volume day.
Mentor’s note: At Stock Market Mentor, this is one of the first corrections given to students moving from textbook Volume Profile to live-chart reading; the profile shape tells you where volume happened, but not why. Reading the “why” is what separates reacting to a POC from actually understanding it.
Common Mistakes Traders Make With Volume Profile
- Treating every POC touch as an automatic buy or sell signal; it isn’t. Context matters.
- Reading only the 5-minute profile while ignoring higher-timeframe structure.
- Stacking too many session profiles on one chart until it becomes unreadable.
- Trading Volume Profile levels without any risk management behind them, a habit that shows up clearly in SEBI’s data on retail losses (more on that below).
Volume Profile is a map of where the market has been, not where it’s going. It works best combined with price action, VWAP, and a clear risk plan, alongside related tools like open interest and swing-level structure reading, not as a stand-alone signal generator tool.
What to Look For in a Volume Profile Course for Beginners?
Since “volume profile trading course” is as much a buying decision as a learning one, here’s what’s worth checking before enrolling anywhere in India:
- Live-market sessions, not just recorded slides. Profiles look different on a real, moving chart than in a static screenshot.
- Backtested strategies, so setups are tested against historical data before you risk capital on them.
- Risk management and position sizing built into the curriculum, not treated as an afterthought.
- Small batch sizes or 1-on-1 access, so questions on live charts actually get answered.
- Indian index examples: NIFTY and Bank NIFTY behave differently from US futures, and a course should reflect that.
Stock Market Mentor’s courses are structured around these points. They run live, mentor-led sessions across their centres in India where traders learn to read market structure on real NIFTY and Bank NIFTY charts, backed by backtesting rather than one-size-fits-all indicator settings. Traders evaluating a course should understand what is backtesting strategy before treating historical results as evidence of future performance.
Who Should Take a Volume Profile Trading Course?
This is appropriate for traders who already know the basics of reading candlesticks and support/resistance and want a more systematic technique to find levels, not total newbies who have never looked at a chart. You don’t need to be certified in technical analysis to start, but it will be much easier to learn if you know how to read a candlestick chart first. It is particularly useful for intraday and positional traders engaged in NIFTY, Bank NIFTY or index/stock futures, less so for someone just investing through mutual funds or long-term equities. Beginners who need to build that foundation can first explore Stock Market for Beginners.
Why Learn Volume Profile With Stock Market Mentor?
Besides the concepts, here’s what’s genuinely provable about the training itself:
- 15+ years of trading education experience, with 10,000+ students trained and a 4.9/5 rating on Google.
- Live interactive classes that walk through historical data and real examples, backed by backtested strategies, so setups are tested before you risk capital on them.
- Position-sizing and risk-management training built into every course, not treated as an add-on.
- Small batch sizes with unlimited post-course doubt-clearing, plus SMM and NISM certification (subject to clearing) on completion. Traders comparing credentials can also understand the difference between NISM certification vs stock market course.
- Centres in Bangalore, Delhi, and Noida NCR, with online and offline options, so this isn’t restricted to one city.
One more thing worth knowing: Stock Market Mentor is an education brand, and it does not provide trading tips, advisory, PMS, or account-management services. It teaches you to build your own analysis instead of handing out calls. That’s a meaningful distinction in a space where a lot of “courses” are really tip services in disguise.
If you want to go deeper into F&O strategy-building alongside Volume Profile, FNO Champion covers position sizing, risk management, and strategy application across market conditions; you can see the full course catalogue here.
Building Practical Skills With a Volume Profile Trading Course
Volume Profile turns a flat volume bar into a full map of where the market actually traded. POC tells you the busiest price, Value Area tells you the fair range, and volume nodes tell you where price is likely to pause or run. None of that replaces a trading plan; it sharpens one.
If you want to build this skill properly, with live NIFTY and Bank NIFTY examples instead of static screenshots, structured mentor-led sessions from Stock Market Mentor are a faster route than piecing it together from scattered videos.
Disclaimer: This article is for educational purposes only and does not constitute investment advice or a recommendation to trade.