Why Noida Traders Must Understand Cup & Handle Pattern?
It’s 9:20 AM. You are sitting at your desk at Sector 62, Noida, with half a cup of coffee and going through charts, when the NSE bell goes off. There is a middle-range IT stock that you were tracking, and the organization has been developing something on its daily chart over three months. You almost killed it last week.
But now, price slips a little beyond a critical resistance point, on lean volume, and drags itself away, almost deferentially. Your cursor is pointing to the purchase.
There is even an official name for that particular price pattern: the cup and handle pattern. Traders who are able to read it do not hover. They are not afraid to do what they believe is right.
What Is the Cup and Handle Pattern?
The cup and handle is one of the strongest bullish continuation patterns of technical analysis, which was first popularized by William O’Neil in How to Make Money in Stocks. It develops when a stock experiences a slow, rounded downward movement and then returns to the previous high. It then settles down and breaks away.
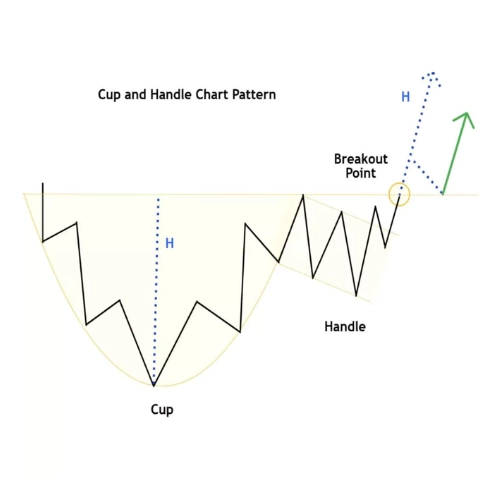
It is visually similar to a teacup when looking at it sideways, with the rounded bottom being the cup, the short consolidation being the handle, and the breakout being the trade entry.
The shape of this pattern is different from the psychology compared to the other chart patterns used in trading. The cup represents drained sales. The recovery test is a test of conviction. The handle shakes out feeble hands one last time – and when the breakout comes, only fanatical purchasers are left.
Common Errors Traders Make with Cup & Handle Pattern: Learn How To Avoid
Not all bottoms that are rounded are good. This is what will make a textbook pattern and an expensive lookalike look different:
- The Cup can not be V-shaped; it must be U-shaped. A steep V-bottom is an indication of panic, rather than accumulation. The depth is to be 15-33% between the peak and the trough, with the formation period between 7 and 65 weeks on the weekly chart.
- The Handle shall be shaped in the upper half of the cup – it is imperative. It is supposed to be a little downward slope, should not be less than a week or two, and is to exhibit diminishing volume throughout. A structural failure is a handle that violates the midpoint of the cup.
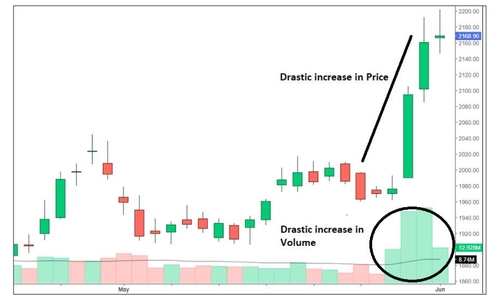
- Most traders make a mistake in Volume Behavior. Volume needs to decrease via the cup and hit the bottom during the handle. On breakout day, it must take off at least 40-50 percent over the 20-day average – the best setups will be seen to print 80-100 percent or better over average. No surge of volume, no sound breakout.
- The Pivot Point, the buy trigger, is a movement that is above the highest point of the handle on above-average volume. This translates best in Indian markets in the form of a daily chart, where there is an upward trend in the Nifty Midcap or Smallcap index
How to Trade Cup and Handle: A Step-by-Step Framework for Noida Traders
Step 1: Scan – Filter Chartlink or TradingView of stocks that are approaching 52-week highs but have fallen 15-30% in 2-6 months, and are now regaining.
Step 2: Qualify – On the weekly chart, make sure that there is a rounded bottom, a regaining trend towards the previous top, and a narrow handle that is created over the midpoint of the cup.
Step 3: Volume Check – Monitor decreasing volume by the handle and the spike by breakout. Both Zerodha Kite and Upstox Pro have volume alerts for this trigger.
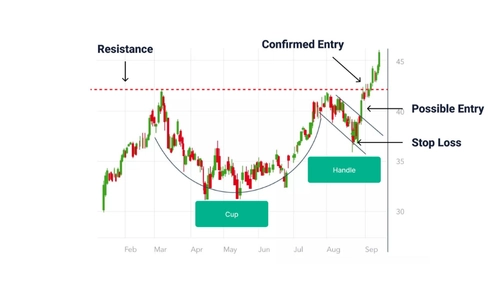
Step 4: Entry – Be near the pivot point. Trying to get 3-5% above it kills your risk-reward. Your signal is a candle that closes on top of resistance against the pivot.
Step: 5 Stop Loss – Right under the entrance of the handle, usually 5 -8%. Fixed, non-negotiable.
Target: Measure the depth of the cup between the bottom and rim. Same distance above the breakout as a project. In upward markets, good stocks regularly outperform this calculated move.
Why Cup & Handle Pattern Works in Indian Market?
The retail trading boom in India has provided just the emotional price movement the cup and handle thrives on, panic selling making the cup, impatient holders exiting the handle, and institutional buyers making the consistent build-up throughout the handle.
The figures attest to the magnitude of this change. According to the data of NSE, the registered investor base in India is unique, and in August 2024, it reached the 10 crore mark, and in September 2025, 12 crore, which is 3 times the number of five years ago. The state of Uttar Pradesh, which houses Noida, has the second largest number of investors in the country at 1.4 crore. This has decreased the median age to 33 (it was 38), and a quarter of investors are below 30.
Further retail involvement will result in greater emotional pricing behavior – more cup and handle book arrangements and a greater likelihood of a disciplined trader. Research indicates that the trend also has a baseline hit rate of 49% in the short term, and 70, 80, and 85% within one year, five years, and ten years, respectively. Confirmation of the volume, RSI alignment, and the success rates increases by another 20%.
Strategic Outlook For Noida Traders on Cup & Handle Pattern
The second advantage of technical analysis patterns for Indian traders is not a new pattern, but an improved performance of the old patterns.
Algorithms have now identified cup and handle structures in only a few seconds, and the interpretation of market context, sector rotation, and underlying quality of the chart continues to require human interpretation. To Noida and its increasingly trader community, the competitive edge is with the pattern recognizers plus process discipline.