
Technical vs Fundamental Analysis: What Should You Learn First?
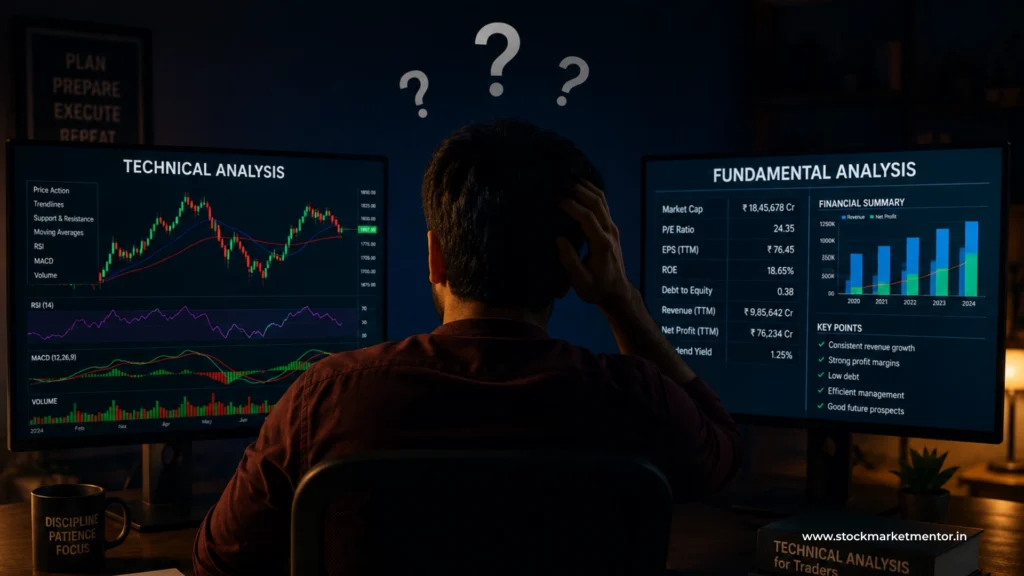
You are eager to invest in the stock market. You opened an account on Zerodha or Upstox. But the application makes you question how? You start scrolling through YouTube, typing “Stock market for beginners.” You find three videos that say completely different things. Isn’t that confusing?
That is one of the most common reasons beginners delay their investment journey in the stock market. Most beginners take weeks or even months to decide which approach to follow, as they don’t want to end up choosing the wrong path. This confusion is quite common among new stock traders.
In this blog post, let’s understand how the stock market learning roadmap helps analyze the differences between technical and fundamental analysis, covering personal temperament and trading objectives, whether you are a beginner trader or an investor.
Technical vs Fundamental Analysis: What's The Core Difference
Technical Analysis involves examining charts, including price movements, the number of buyers/sellers, and market patterns. Fundamental Analysis evaluates the firm behind the shares, including its revenues, profitability, liabilities, leadership, and prospects.
Short-Term Profit (Trading)
Are you planning to start trading in the Indian stock market, either intraday or swing trading? Then, technical analysis will be your preferred choice.
Why it works for novice traders:
- Learn the basics in a couple of weeks.
- Can use it from day one.
- Works both for short- and long-term charts.
Long-Term Wealth (Investing)
If you plan to invest your money for many years, e.g., 5-20 years, it is best to use fundamental analysis.
It will help you:
- Select good companies with sustainable growth.
- Eliminate bad companies with temporary value.
- Assess the intrinsic worth of a stock.
- Accumulate wealth gradually.
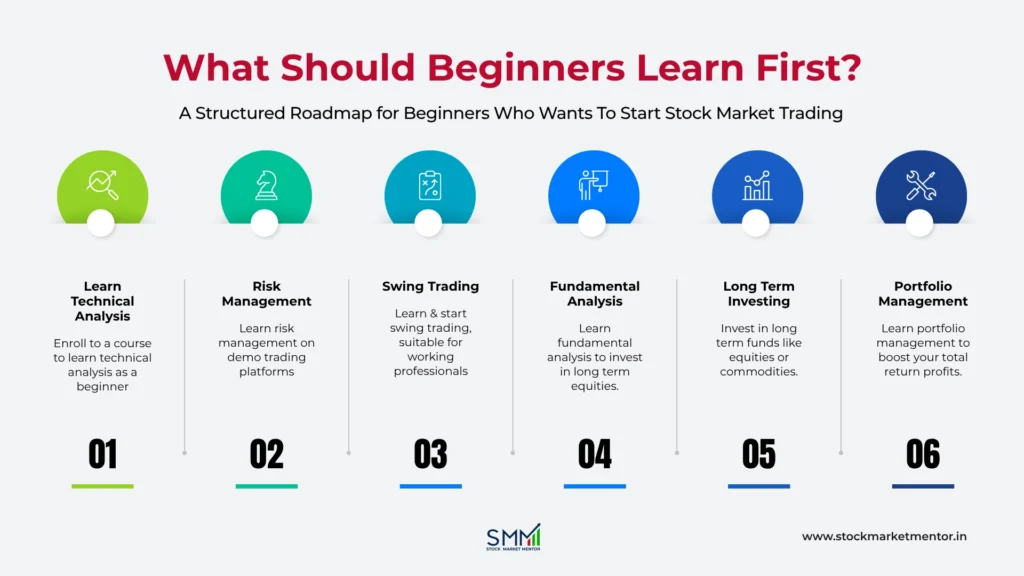
What Is The Best Approach?
Begin with Technical Analysis to see how the market operates and develop your confidence. Then move on to Fundamental Analysis to pick better investment stocks.
What Is Technical Analysis? Quick Information You Must Know About It
According to Investopedia, Technical Analysis is defined as the methodology of using historical price/volume data in the marketplace to estimate future prices, volumes, and events in stock and commodity markets.
Three main assumptions are the backbone of Technical Analysis:
- The market has already priced in all known facts about the individual security.
- The market trend persists once established.
- Historical price movement repeats itself.
You will use chart patterns, chart indicators, and chart formations to identify potential trading opportunities here.
Example: Rahul, a beginner trader from Noida, learned Technical Analysis in about 6 weeks. While studying Reliance stock, he noticed:
- The stock price was holding at the support level of Rs 2800.
- A bullish chart pattern was forming.
- The Relative Strength Index (RSI) showed the stock had been oversold.
Rahul purchased the stock at Rs 2815 and set a stop-loss order at Rs 2770. In just 10 days, the stock price reached ₹2960, a 5% return profit from his entry point.
What You’ll Learn in Technical Analysis?
- Candlestick Patterns: These are the Patterns on charts that help a trader identify possible future price trends.
- Relative Strength Index (RSI): This indicates if a stock is in an overbought or oversold position relative to its previous price/volume action.
- Moving Average Convergence Divergence (MACD): This indicator provides signals of trend direction and possible future trend reversal.
- Volume: This indicates how strong a stock will continue to move in its current direction.
- Trendlines & Trend Channels: These lines help identify established trend direction and potential boundaries.
New traders use TradingView to practice charting because it is free, and is used by professional traders as part of Stock market courses in Noida and Delhi.
What Is Fundamental Analysis? Things Beginners Should Know About It
Before investing, investors use fundamental analysis to assess a business’s prospects. Fundamental analysis considers the company’s earnings, growth, the amount of borrowing (debt), and how the company could potentially evolve in the future. Investors can determine whether the cost of purchasing a stock is low or high for long-term profit.
Example: Priya works as a human resources professional and has been investing since 2019. She prefers not to trade daily but rather to invest for the long term.
- Review Infosys’s revenue growth rate, 12% to 18% annually.
- Look at Infosys’s price-to-earnings (P/E) ratio, which is below its historical average.
- The company had no long-term debt with strong cash flow.
She invested ₹100,000 at ₹680/share for Infosys in April 2020. Value of her holdings developed from April 2020 to 2024:
- Stock price grew to over ₹1,600 (approximately 138% increase).
- Gained dividend income over this period.
Priya did not use charts or trade frequently; rather, she used solid research to produce appreciable returns.
What You’ll Learn in Fundamental Analysis?
- P/E Ratio: Price you pay for ₹1 of the company’s profit.
- EPS: Profit earned per share.
- Revenue Growth: Is the company’s sales increasing regularly?
- Net Profit Margin: How much profit is made from total sales.
- Debt-to-Equity: How much debt vs own money.
- Free Cash Flow (FCF): Actual cash left after expenses.
Screener is one of the best free fundamental analysis platforms for Indian stocks. You can start learning fundamental analysis by joining our “The Value Investor” course online or offline from anywhere in India. You’ll directly learn from top mentors with 16+ years of trading experience
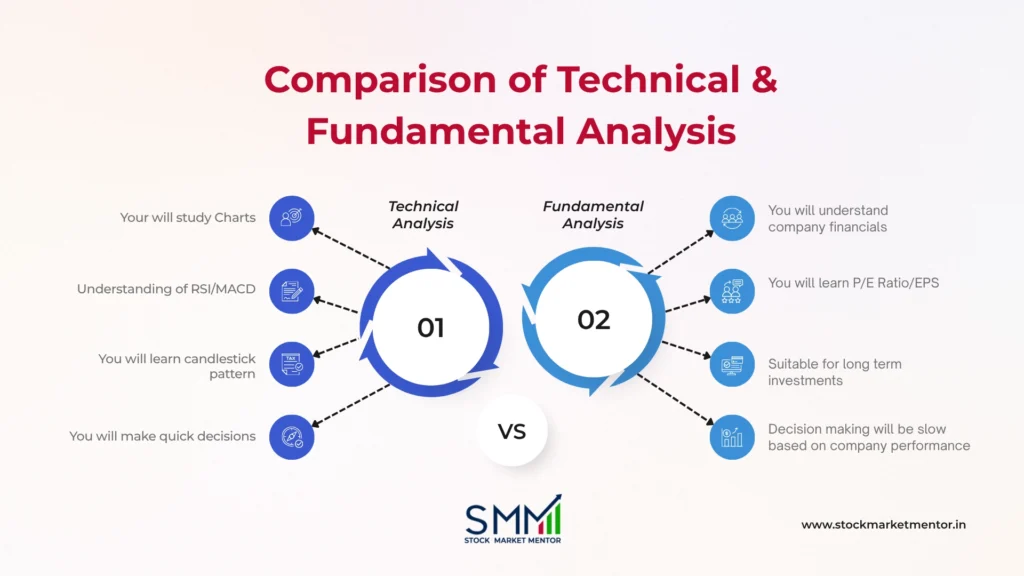
What Are The Key Differences Between Technical & Fundamental Analysis?
| Factor | Technical Analysis | Fundamental Analysis |
|---|---|---|
| Timeframe | Short-term | Long-term |
| Focus | Price charts & patterns | Company financials & ratios |
| Tools Used | RSI, MACD, Candlesticks | P/E Ratio, EPS, Revenue |
| Learning Curve | Moderate, like 2-4 months | Moderate to High, like 3-6 months |
| Best For | Day traders & swing traders | Long-term investors & SIPs |
| Popular in Delhi/Noida | Very High | Moderate |
| Decision Speed | Fast (real-time) | Slow (quarterly data) |
| Risk Level | Higher (short-term) | Lower (long-term) |
Conclusion: Learn Technical & Fundamental Analysis in India
If you’re a beginner trader in Delhi or Noida, wondering whether to start by learning Technical or Fundamental Analysis, the answer is simple: follow a stock market learning roadmap that builds real understanding.
Trading in the Indian stock market offers strong long-term wealth potential. Instead of relying on random content, focus on guided learning and mentorship from experienced traders in Delhi & Noida.
If you’re serious about starting your trading journey the right way, now is the time to take that first step with the right support.