Intraday trading in India may appear simple, but data shows otherwise. According to statistics published by the Securities and Exchange Board of India, nearly 70% of individual traders in the equity cash segment incur losses while trading intraday.
Emotional decision-making and the lack of rule-based strategies are the main causes of these losses, not just market volatility. In the fast-moving NSE markets, intraday indicators are crucial in helping traders plan their entries, exits, and risk management. This pattern is repeatedly highlighted in detailed breakdowns of stock market losses, where overtrading, emotional execution, and poor risk management remain the most common reasons.
This article explains which intraday indicators work best for Indian traders and how they reduce losses by improving discipline and decision-making.
Why Do Intraday Indicators Matter So Much?
Intraday trading is all about speed. Prices move quickly, especially during the first hour after the market opens at 9:15 AM. Without intraday indicators, traders are mostly guessing.
Intraday indicators help filter market noise. They show whether a stock is strong, weak, overbought, or oversold. They also help traders avoid emotional decisions like panic buying or fear selling. Intraday indicators are a core component of technical analysis in the Indian stock market, where decisions are made based on price behaviour, volume, and momentum instead of predictions or tips.
Studies show that around 70% of individual intraday traders lose money, mainly due to lack of discipline and poor strategy. Using the right intraday indicators helps traders make rule-based decisions instead of emotional ones, which is one of the main reasons disciplined traders survive longer in intraday markets.
Which Intraday Indicators Actually Help Traders?
Not all indicators work well for intraday trading. Some are slow and give late signals. The most useful intraday indicators are those that react quickly to price changes.
The internal brokerage performance reviews have noted that traders who mix various intraday indicators, as opposed to using one signal, are more likely to have consistent results in the long term. Many traders prefer applying these indicators to liquid large-cap and blue-chip stocks, as stable volumes and tighter spreads make intraday execution more reliable.
Some of the most commonly used intraday indicators are:
EMA (Exponential Moving Average)
EMA gives more importance to recent prices. It is highly applicable to short periods, such as 5 minutes or 15 minutes charts. It assists traders in picking up momentum.
RSI (Relative Strength Index)
RSI indicates the overbought or oversold stock. A value of above 70 is generally an indicator of overbought, and below 30 is oversold. This assists in the refining of entry and exit decisions.
MACD
MACD follows momentum using crossovers and changes of histograms. It is usually applied to verify trends as opposed to forecasting them.
The popularity of these indicators is due to the fact that they adapt fast to market volatility.
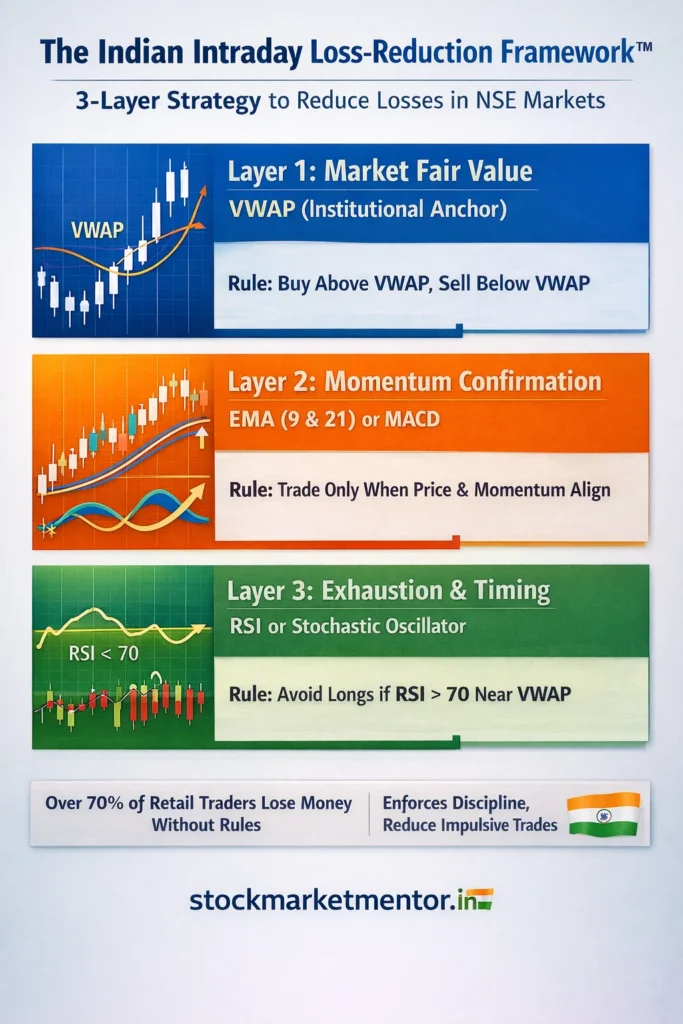
The Indian Intraday Loss-Reduction Framework™ (Proprietary)
- Layer 1: Institutional Anchor, or Market Fair Value: VWAP is required. Higher failure rates are seen in trades made against VWAP between 9:15 and 10:15 AM.
Rule: Only purchase above VWAP and only sell below VWAP
- Layer 2: Retail Trap Filter Momentum Confirmation: MACD or EMA (9 & 21) filters out false breakouts brought on by volatility in the opening
Rule: No trade unless momentum and price direction coincide
- Layer 3: Timing and Exhaustion (Loss Control): Stochastic oscillator, or RSI used to time entry rather than predict trends
Rule: Steer clear of longs when RSI > 70 close to VWAP resistance
How VWAP Improves Intraday Indicators Performance?
VWAP stands for Volume Weighted Average Price. VWAP is widely used by professional traders and forms the foundation of many algorithmic trading models operating in Indian markets.
VWAP acts like a fair value line. A reversal can be indicated when prices are too high or too low for VWAP. This comes in handy, particularly after 10 AM, when the market volatility begins to calm down.
Market participation statistics show that most retail day traders make net annual losses, and professional traders who trade based on VWAP frameworks are not trying to make large intraday gains; but instead, they are trying to capture small, repeatable, price inefficiencies in highly liquid stocks.
In combination with RSI or EMA, intraday indicators are more accurate and less false signals
Why Are Bollinger Bands Popular Intraday Indicators?
Another popular intraday indicator that is used is the Bollinger Bands, particularly in sideways or range-bound markets.
They are composed of the upper band, lower band and the middle moving average. When the volatility is high, the bands widen and when it is low, the bands narrow.
Studies indicate that approximately 88% of Nifty trading sessions are range-bound and therefore, Bollinger Bands are quite handy to intraday traders.
Bollinger Bands, used together with MACD, can be used to verify breakouts and minimise false signals. This is important because only around 4% of trained day traders manage to earn a sustainable income, even after practising for 6–8 hours daily.
Can Stochastic Oscillator Improve Intraday Indicators Results?
The Stochastic Oscillator is especially useful in markets that are moving sideways. It compares the closing price with the price range over a specific period.
This intraday indicator works well because it identifies exhaustion points early. Studies show that around 40% of day traders quit within the first month, often because they enter trades too late. Many traders struggle because intraday trading may not suit their temperament compared to swing or long-term trading approaches, leading to forced trades and emotional exits.
Using a 14-period Stochastic setting on shorter charts like 1-minute timeframes has shown better performance than RSI alone. When combined with VWAP, proprietary trading desk reviews have reported profitability rates close to 16%.

What Is the Real Secret Behind Using Intraday Indicators?
The biggest mistake traders make is using too many intraday indicators without testing them properly. Indicators are tools, not magic formulas.
Backtesting intraday indicators on platforms like the Stockmarketmentor helps traders understand what works and what does not. While some profitability studies reference global markets such as Brazil, similar behavioural patterns and loss ratios are consistently observed among retail intraday traders in Indian equity markets as well. Data shows that in countries like Brazil, only 3% of day traders are profitable, mainly because most people skip testing and discipline.
Instead of chasing big profits, experienced traders focus on 1–4% monthly returns and follow strict rules. They also avoid over-optimising strategies, which often leads to failure in live markets.
Final Thoughts on Intraday Indicators for Consistency
Intraday trading is still very risky, and market data has been very clear that the majority of participants lose money. Nevertheless, trained application of intraday indicators enables traders to act according to preset rules, minimize emotional choices, and manage losses in the long run.
EMA, RSI, MACD, VWAP, Bollinger Bands and the Stochastic Oscillator are all indicators that are best used in combination in a tested system. The only way to achieve consistency in intraday trading is not through shortcuts, but through realistic expectations, constant testing and strict adherence to rules. Traders who invest time in structured learning and rule-based execution such as through focused intraday trading programs are better positioned to survive long-term market volatility