Predicting reversals often feels impossible when you’re new to trading. You see prices rising and falling, but knowing when they might turn is the real skill. One tool that quietly gives you an early warning is the RSI divergence indicator. At Stock Market Mentor, we help students build confidence with tools like this because technical signals can guide you long before news headlines ever do.
Pause for a moment.
How many times have you watched a stock keep rising, felt the urge to jump in, and then seen it reverse shortly after you bought?
This is exactly the situation where the RSI divergence indicator quietly gives clues, if you know how to read it.
With time and practice, the indicator becomes a simple way to interpret market strength even before price reacts. Many students who doubted technical analysis at first eventually discover how reliable momentum patterns can be once they learn to read them properly. Understanding indicators like RSI divergence helps traders navigate the real stock market difficulties that aren’t obvious on the surface.
What Makes the RSI Divergence Indicator Such a Game-Changer?
The RSI divergence indicator is built on the Relative Strength Index, created by J. Welles Wilder back in 1978. Even though nearly 75% of traders use RSI, most never understand divergences deeply.
That’s where you gain an edge. Divergences reveal momentum shifts before price reacts, which is exactly why many experienced traders say divergence signals helped them stop chasing trends blindly and start trading with intention.
Picture this: a stock keeps touching higher prices, but RSI quietly forms lower highs. That mismatch is exactly the kind of clue the RSI divergence indicator was designed to show. It’s almost like the indicator hinting, “This push is weakening.” And once you see this pattern a few times in real charts, it becomes easier to trust what momentum is telling you rather than reacting emotionally to every price move.
The Two Types of RSI Divergence Every Trader Must Know
There are only two types of divergences, but they hold enormous value once you know how to spot them.
Before you move on, remember this:
Divergence doesn’t predict exact timing. It highlights weakness building beneath the surface.
Once you accept that, the signals start making far more sense.
Bullish Divergence
Say your stock dropped to $50 with RSI at 30, then bounced to $55 with RSI at 35. Price made a lower low earlier, but RSI didn’t. That’s the indicator suggesting selling pressure is losing steam. Many new traders are surprised by how often this marks the beginning of a meaningful reversal, especially when combined with strong support levels.
Bearish Divergence
If a stock climbs to $100 with RSI at 70 and then edges up again to $105 with RSI only at 65, price is rising but momentum is not. This signal warns that buyers are slowing down. When you learn to catch this early, it becomes easier to avoid buying at market tops or holding long positions too late.
Both of these are core functions of the RSI divergence indicator.
Why Higher Timeframes Give Better Signals ?
Something we emphasize at Stock Market Mentor: divergences on daily charts are far more reliable than those on tiny intraday charts. A study showed daily divergences had a 66% historical win rate. Shorter timeframes? Far more false alarms, because price noise hides real momentum shifts.
One trader spotted a bullish divergence on a daily chart of a currency pair and ended up capturing a 15% move when the reversal unfolded—proof that patience with higher timeframes pays off. Students who slow down and move away from hyper-short charts often improve dramatically, simply because the clearer signals reduce emotional trading. Many traders first notice reliable RSI divergence setups when analyzing blue-chip stocks in India, where price action is cleaner and less influenced by short-term noise.
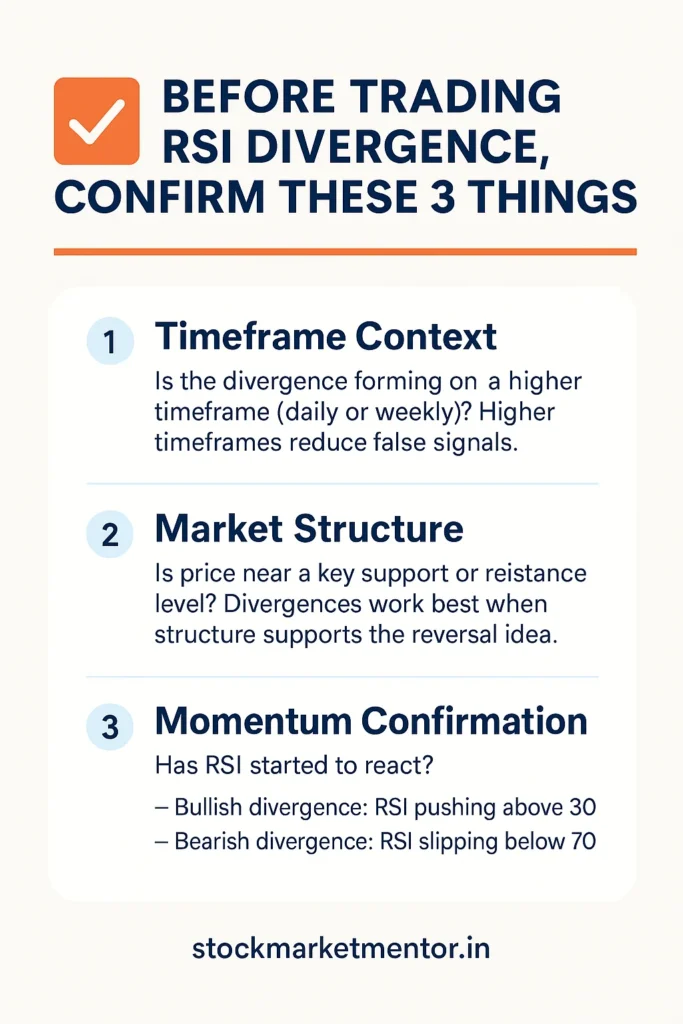
Three Practical Ways to Use the RSI Divergence Indicator Effectively
Want to strengthen each signal? Combine the indicator with simple chart tools:
Pair it with Support and Resistance
If price touches a strong support level while RSI forms a bullish divergence, your conviction rises. Many traders wait for such “double confirmation” before entering.
For example, a stock repeatedly bounces from ₹150. When the price touches ₹150 again and RSI shows bullish divergence, it suggests strong support. Many traders wait for this combination before entering a trade.
Use it with Moving Averages
When bullish divergence forms while price is above the 200-day average, accuracy often improves by 10–15% according to research. This combination filters weak setups and keeps you aligned with the broader trend.
For example, a stock above its 200-day average showing divergence often resumes its uptrend after a short dip.
Watch for RSI Level Breaks
- During bullish divergence, an RSI crossing above 30 adds confirmation.
- During bearish divergence, RSI slipping below 70 strengthens the reversal case.
What Research and Backtesting Say About RSI Divergence?
Backtests on the S&P 500 since 1993 showed:
- Mean-reversion strategies using RSI signals had a 71% win rate with ~0.82% average gain per trade.
- When divergences were added, win rates jumped to 91% across 235 trades.
It proves one thing clearly: the RSI divergence indicator works best as part of a complete trading plan not alone. RSI divergence strategies have also shown effectiveness across major indices, including Nifty and Sensex movements, especially during range-bound phases.
The Hidden Risk Beginners Don’t Notice
Strong trends can make divergences tricky. RSI can stay overbought or oversold for long periods, and during those times a divergence might appear but fail. Many beginners get trapped here because they assume every divergence means reversal. These risks become even more important when considering the risks of investing in global markets, where volatility and news sensitivity are higher.
This is why timeframe context matters.
A bearish divergence on a 4-hour chart inside a powerful daily uptrend may mislead you. But a bearish divergence on a daily chart after the trend weakens? That’s meaningful.
Many of the common stock market losses beginners face happen because traders ignore momentum warnings and enter trades emotionally.
How This Tool Became a Staple for Modern Traders?
The RSI divergence indicator was not always user friendly. Previous traders used to make charts manually and had to identify patterns manually. Today, charting platforms have the ability to point out divergences in real time. However, even at that point, the actual ability is to know what the signal conveys, rather than merely to perceive it. That is why the appropriate guidance and organized practice are highly important. Even as the future of stock trading with AI evolves, understanding core momentum concepts like RSI divergence remains a critical human edge.
Your First Steps to Practice the RSI Divergence Indicator
The simplest way to begin:
- Open a daily chart of any stock.
- Add a 14-period RSI.
- Look for situations where price forms a new high or low but RSI does not.
After spotting 10–15 examples, start testing setups with proper risk rules. At Stock Market Mentor, we teach students to build confidence slowly—learning the pattern first, then applying controlled entries.
Final Thought
Start using the RSI divergence indicator with patience and steady practice. It works across stocks, forex, crypto, and indices. Once you recognize how divergences quietly warn you before major turns, your confidence grows. Master it, and you’ll stay far ahead of most new traders learning the market.
Before enrolling anywhere, it’s wise to review these questions to ask before taking stock trading courses so your learning path stays practical and realistic. Establish a good market base with Stock Market Mentor. Learn to read the charts, create a strategy, and be a disciplined trader by attending structured courses that can help you build confidence, clarity, and realistic expectations in the financial markets.